PowerShares ETF Nasdaq 100 - QQQ - 07/05/2018
Short Term strategy: Positive (70%) / Trend +
Long Term strategy: Positive (95%) / Trend =
Characteristics of the ETF
The QQQ ETF (Powershares), which is quoted in USD on the Nasdaq, replicates the Nasdaq 100 index which is composed of the top 100 non-financial US stocks, mainly in the technology sector and listed on the Nasdaq, selected according to the importance of their market capitalization.
The ETF fees are 0.2% and the AUM is very high at $61bn. Replication is direct (physical) and there is a dividend distribution policy.
Alternative ETFS: ANX (Amundi in Euro), UST (Lyxor in Euro), CNDX (iShares in USD)
Latest developments
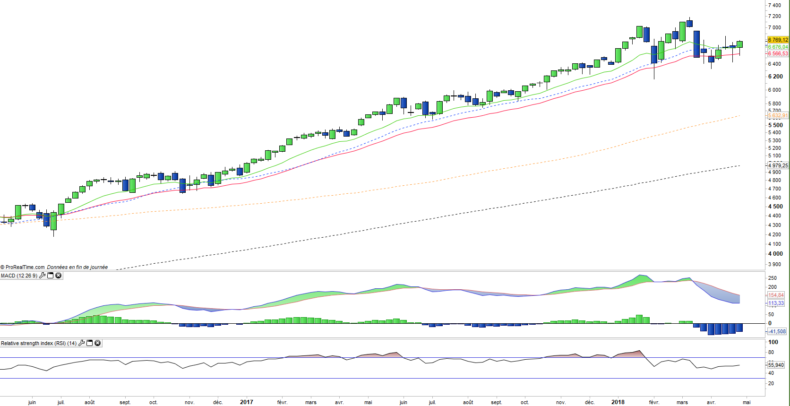
The Nasdaq100 rose by 31.5% in 2017, the highest annual increase since the rebound in 2009, the rise of the beginning of the year was completely erased by the correction of February / March but the index is rebounding and displays now a rise of + 5.8% since the beginning of 2018.
The rebound of large US technology stocks is linked to the good Q118 results of GAFAs, primarily Apple which grew by 13% last week, but also those of Facebook and Amazon after a negative pressure of several weeks, related to the scandal of data users for Facebook and the D.Trump’s threat to Amazon.
The 12-month P / E is currently 22X while the earnings growth is expected to once again exceed 10% in 2018. In addition, the semiconductor sector is rebounding after Apple's reassuring results.
Index & components
The top 10 stocks in the index, including Apple, Amazon, Alphabet, Facebook and Microsoft, account for about 56% of the market capitalization of the index, while Apple alone accounts for 12.1% of the index.
The interest of this index lies in the fact of taking a diversified bet but concentrated on the most beautiful technological stocks, giving a good share to the "GAFA" (Google, Apple, Facebook and Amazon) which represent 36% of the capitalization. The index is particularly influenced by Apple's prices, which fluctuate according to the success of its new smartphones. Note that large technology stocks have generally performed very well in 2017, especially GAFA but also semiconductors (Intel) and Microsoft.
Large biotech stocks such as Gilead and Amgen have been less buoyant despite a year-end rebound due to uncertainties in both their pipeline and US health policy, as well as the decline in speculative premiums after the failure of major transatlantic operations. However, the attractiveness of US biotech companies remains significant at a national level, and these are prime targets for major US laboratories, as well as an alternative to transcontinental operations.
The volatility of the index is not very marked, which reflects the considerable weight of market capitalizations often above $ 300 billion for the top 10 companies, see $ 500 billion for the top 5. But the Nasdaq 100 is not just about its top 10 stocks, and the depth of the index makes it possible to invest in companies that are already established but still have a strong appreciation potential like Tesla, Xilinx or Symantec.
The hegemonic position of the GAFA in the world begins to provoke reactions, especially in Europe, both on competitive positions or abuse of dominant positions could trigger heavy fines, as seems to be emerging for Google, but also on taxation while European countries seek to find an agreement to tax the revenues generated on their territory. Chinese competitors are becoming more and more present, such as Alibaba or Tencent, and could soon threaten the supremacy of the leaders of American technology.
Weekly data
The weekly chart shows a credible bullish reaction at the weekly level, after several weeks of correction and the fairly deep bearish attack in March that led to the breakout of the EMA26. The oscillators have now turned upwards, with the exception of the MACD, which is just beginning its bullish inflection. The bullish breakout has to be confirmed this week, but seems to validate the end of the correction.
Daily data
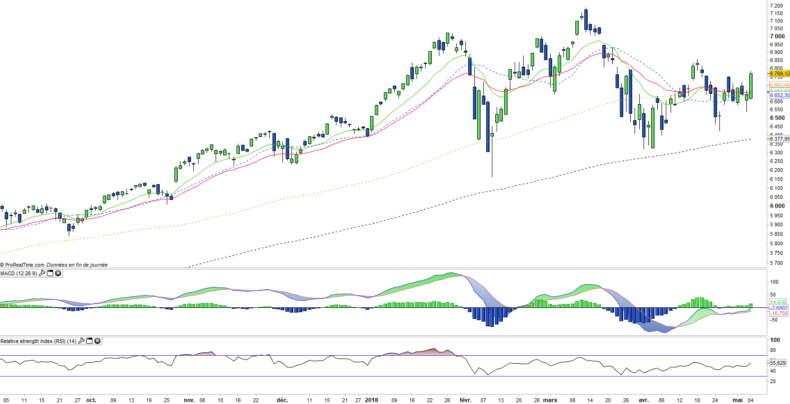
On the daily chart, we can see the Friday’s big bullish candlestick, which seems to end the period of wavering that gave rise to the extended test of support materialized by the EMA100 days. This candlestick requires confirmation in the short term, but seems to be a sufficient credible signal to consider continuing the move towards the highest of the year.
ETF Objective
QQQ is an ETF listed in USD, which seeks to replicate the Nasdaq100 index (103 US companies)
Characteristics
| Inception date | 10/03/1999 |
| Expense ratio | 0,2% |
| Benchmark | Nasdaq 100 |
| Issuer | PowerShares |
| Ticker | QQQ |
| ISIN | US73935A1043 |
| Currency | $ |
| Exchange | Nasdaq |
| Assets Under Management | 61 400 M$ |
| Replication Method | Direct (Physical) |
| Dividend | Distribution |
| Currency risk | No |
| Number of Holdings | 103 |
| Risk | 3/5 |
Country Breakdown
| USA | 97% |
| China | 2% |
| United Kingdom | 1% |
Sector Breakdown
| Information technology | 61% |
| Consumer discretionary | 22% |
| Health Care | 10% |
| Consumer Staples | 4% |
| Industrials | 2% |
| Telecom services | 1% |
Top Ten Holdings
| Apple | 11% |
| Alphabet | 9% |
| Microsoft | 9% |
| Amazon | 9% |
| 5% | |
| Intel | 3% |
| Cisco | 3% |
| Comcast | 2% |
| Nvidia | 2% |


