Amundi ETF China (CC1) - 14/02/19
Short Term strategy: Positive (100%) / Trend +
Long Term strategy: Positive (90%) / Trend +
Characteristics of the ETF
The CC1 ETF (Amundi) created in 03/2009 is listed in EURO on Euronext and replicates the MSCI China-H net dividends reinvested index ("net return"), which is composed of the main Chinese stocks listed in Hong Kong and composed for 2/3 of financial values. These stocks are subject to Chinese regulation but denominated in Hong Kong dollar (HKD). Chinese H shares, unlike A shares, are available to non-resident investors in China.
The target for maximum tracking error between changes in the net asset value of the Fund and that of the MSCI China H Index is 2%. This tracker presents a currency risk linked to the exposure of the MSCI China H Index, resulting from the evolution of the reference currency, the Hong Kong dollar (HKD).
The fee of this ETF is 0.55% for an AUM of 117M €. The replication method is synthetic (via swaps).
Alternative ETFs: CSIA (Lyxor in Euro), FXI (iShares in USD)
Latest developments
The CC1 index has risen by 10.1% YTD and thus completely wipes out the 2018 drop (-8.75%) by returning to the end-2017 level. This recovery is naturally due to the hopes of a trade agreement between the US and China, while D. Trump has just mentioned the possibility of postponing announced tariff increases after March 1 if significant progress is made, which seems to indicate that this is probably the case but that negotiators still have need time to finalize an agreement that the US wants global.
Chinese growth has been in sharp decline in recent months, due to domestic constraints ( government's restrictions on credit access to reduce corporate indebtedness) and external constraints (trade war, growtj slowdown in Europe). The decline in Chinese growth could also lead in the end to political issues, if it accelerates further. The Chinese authorities have an interest in calming the game, and adressing the decline before it is too late..
Index & components
The equities that make up the MSCI China-H Index come from the universe of the most important stocks in the Chinese market.
The MSCI China-H Index is composed of 50 constituents, so it is relatively diversified. The financial sector (banks and insurance companies), however, accounts for about 68% of the capitalization while the China Construction Bank accounts for 16% of the index.
China is the world's second largest economy behind the US with a GDP of about $ 13600bn in 2017, the world's largest exporter with the world's largest foreign exchange reserves. The global recession of 2009 interrupted China's continued growth momentum, and the limits of its export-oriented growth model emerged. As a result of the global economic downturn and declining trade, Chinese growth decelerated to below 7% in 2015, its lowest level in 25 years. However, in 2017, growth reached 6.9% of GDP, an improvement over 2016 (6.7%). State-owned enterprise debt accounts for 145% of GDP while private sector debt accounts for more than 200% of GDP. In addition, the quality of bank assets has deteriorated for several years and this trend is probably underestimated because of the importance of the shadow banking. Many challenges remain linked to the problem of an aging population, the lack of openness of the political system, the competitiveness of an economy dependent on high investment expenditure and the expansion of credit. The manufacturing and construction sectors contribute nearly half of China's GDP, but the country is increasingly relying on services and domestic consumption.
China has posted a 6.6% growth rate in 2018 and now expects growth between 6- 6.5% n 2019, which means a gradual soft landing linked to the new growth model, more based on quality, corresponding to an upscaling of industry and services, but also focused on reducing the current major imbalances (too high debt, overcapacity in industry and real estate).
China no longer seems to be in the race for growth, but in search of a more balanced and sustainable model based on the upscaling of its industry through technology and the expansion of services and domestic consumption. China faces geopolitical problems with most of its neighbors (India, Japan ...) and especially in the China Sea, because of its plans for territorial expansion that could lead to military confrontations. Its confrontation with the USA, at the commercial level, could be amplified under the background of the Korean crisis.
Monthly data
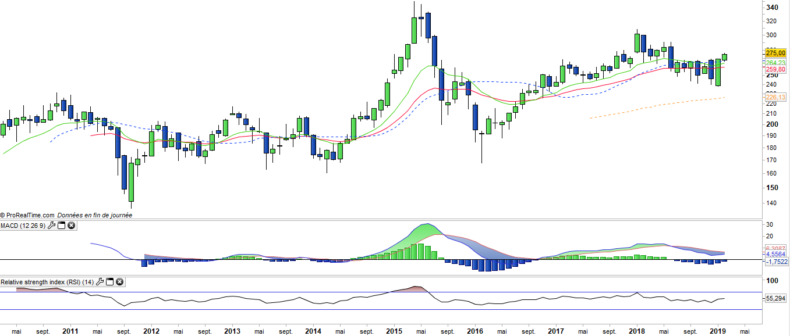
The monthly chart shows an important figure that represents a monthly bullish engulfing validated in january thanks to a strong bullish candlestick of an amplitude of nearly 10% that cancels the decline of the last 6 months and validate a recovery of the long term positive trend by returning above the EMAs 13,20 and 26. It remains to be seen whether this recovery will lead to a continuation of the rise or a stabilization in the form of trading range.
Weekly data
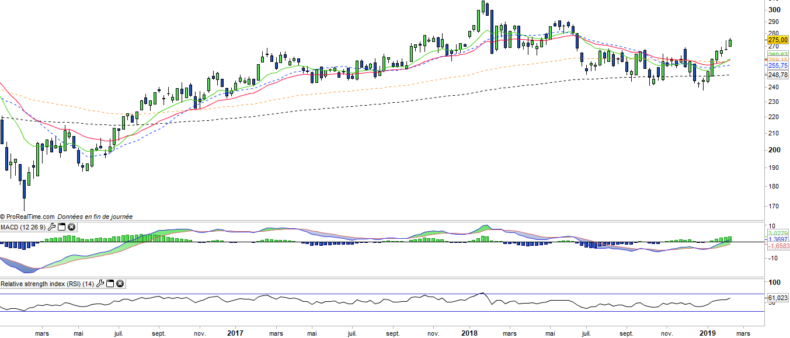
The weekly chart shows the bullish breakout of the bearish line at the end of January, which has since been confirmed by the upward crossing of the EMAs13 & 26, coupled with the crossing of the zero line by the MACD. The other significant technical point is the overtaking of the 270€ resistance on which the index had been hitting (and failing) since the summer. CC1 has technically released major blocking points in the past 3 weeks. The short-term target is a return to the 2018 peak to 290 €.
Theme
CC1 is a UCITS ETF, listed in EUR, which seeks to replicate the MSCI China H index (50 chinese companies)
Characteristics
| Inception date | 03/03/2009 |
| Expense ratio | 0,55% |
| Issuer | Amundi |
| Benchmark |
MSCI China H
|
| Code/Ticker | CC1 |
| ISIN | LU1681043912 |
| UCITS | Yes |
| EU-SD Status | Out of scope |
| Currency | Euro |
| Exchange | Euronext Paris |
| Assets Under Management | 117 M€ |
| PEA (France) | Yes |
| SRD (France) | Yes |
| Currency risk | Yes |
| Number of holdings | 50 |
| Risk | 4/5 |
Country Breakdown
| China | 100% |
Sector Breakdown
| Financials | 66% |
| Energy | 9% |
| Industrials | 7% |
| Materials | 4% |
| Communication services | 4% |
| Consumer discretionary | 3% |
| Health Care | 2% |
| Others | 5% |
Top Ten Holdings
| China Construct Bank | 17% |
| ICBC | 10% |
| Ping an Assurance | 10% |
| Bank of China | 7% |
| China Petroleum Chem | 4% |
| Petrochina Co | 3% |
| China Life Insurance | 3% |
| Agricult BK China | 3% |
| China Merchants Bk | 3% |
| China Pacific Insur | 2% |


