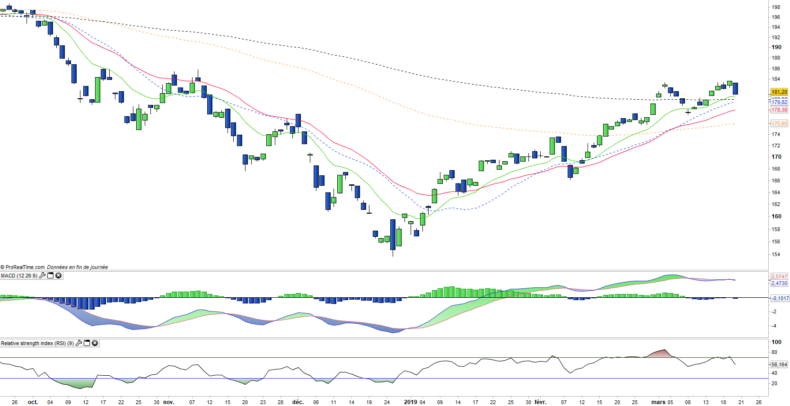
Lyxor ETF CAC Mid60 UCITS (CACM) - 20/03/19
Short Term trend: Positive (90/100)
Long Term trend: Positive (85/100)
Characteristics of the ETF
The CACM ETF (Lyxor), created in 05/2011 is listed in Euro on Euronext Paris and replicates the CAC Mid 60 Gross Total Return index which is composed of 60 French mid-cap companies ranked among the 61st and 120th most traded stocks on Euronext Paris.
The fee of the CACM ETF is 0.5% and the AUM is € 37M. Replication is indirect (via swap) and there is a dividend distribution policy.
Alternative ETFS: EWQ (iShares)
Index profile
The CACMid60 rose by + 25.1% in 2017, a performance well above the CAC40 (+ 9.3%) as it was already the case in 2016 (+ 7.9% against + 4.9%) However the index has posted a decrease of -18.9% in 2018 , underperforming the CAC40 (-11%) for the first time in a long time. This sharp decline at the end of the year was linked to fears about global growth, while the impact of recessions is traditionally stronger on medium-sized companies, less diversified in terms of activities and geographies and also while multiple valuations became demanding.
The index has rallied nearly 15% since the beginning of the year, because of good news in terms of trade war and central bank policy.
CACMID60 is made up of "big mid-caps", of which the three most represented sectors are industry (25%), Finance (17% and health (14%). The first 10 lines represent 34% of the capitalization and are composed of emblematic growth stocks such as Eurofins Scientific, Rubis or Orpea but also leading companies in their sectors such as Ipsen or Getlink. Unlike the CAC40, the index does not include banks or major oil companies.
The CACMID 60 index is composed of companies that are more dependent on the domestic market than the world leaders in cac40 but are already very international and very structured. Above all, their growth potential appears on average to be much greater than the large groups of the CAC40, since they often evolve in still fragmented and growing markets (health, technology, consumer goods), but also cyclical for a significant part of the index (industry and materials account for 25% of capitalization), which should continue to benefit from the improvement in the French economy. One of the characteristics of these companies, is that they are more easily targets than the CAC40 groups, because of a lower market capitalization, without the capital being on average more controlled. The increase in M & A transactions should therefore benefit the index in the coming months.
The medium-term potential of the index is high, especially as the valuation looks rather undemanding after the correction and because of the growth potential.
Technical analysis
Weekly analysis
The weekly chart shows an almost complete trend’s recovery on the medium term horizon. Prices continue to rise and should quickly reach the 2018 peak. Although rising 20% since the lows, the index does not show any obvious signs of overbought situation with oscillators well oriented but without overheating. The crossing of the EMAs 13 & 26 is expected shortly and will confirm the positive trend reversal.
Daily analysis
On the daily chart we can visualize the reversal that occurred on the index as well as the crossing of all resistances, without pause or consolidation. Returning above the EMA100, then more recently the EMA200, without much volatility, the index confirms its return in an uptrend and should return quickly to its October 2018 levels, before the end of year correction.
Theme
CACM is a UCITS ETF, which seeks to replicate the CAC Mid60 Gross Total Return (60 french companies)
Characteristics
| Inception date | 13/05/2011 |
| Expense ratio | 0,50% |
| Issuer | Lyxor |
| Benchmark | CAC Mid60 Gross Total Return |
| Ticker | CACM |
| ISIN | FR0011041334 |
| UCITS | Yes |
| EU-SD Status | Out of scope |
| Currency | € |
| Exchange | Euronext Paris |
| Assets Under Management | 37 M€ |
| Dividend | Distribution |
| PEA (France) | Yes |
| SRD (France) | Yes |
| Number of Holdings | 60 |
| Risk | 3/5 |
Country Breakdown
| France | 93% |
| Luxembourg | 4% |
| Netherlands | 3% |
Sector Breakdown
| Industrials | 24% |
| Health Care | 17% |
| Financials | 14% |
| Communication Services | 10% |
| Information Technology | 8% |
| Consumer Discretionary | 7% |
| Real Estate | 6% |
| Others | 13% |
Top Ten Holdings
| Groupe Eurotunnel | 4% |
| ADP | 4% |
| Ipsen | 4% |
| Rubis | 4% |
| Orpéa | 4% |
| Eurofins Scientific | 3% |
| Bolloré | 3% |
| CNP Assurances | 3% |
| Covivio | 3% |
| Dassault Aviation | 3% |


