Amundi Global Luxury (GLUX) - 27/03/19
Short Term trend: Positive (65/100)
Long Term trend: Positive (85/100)
(scores computed by our proprietary algorithmms)
We Buy GLUX (in our Megatrend EuroPortfolio)
Characteristics of the ETF
The GLUX (Amundi) tracker replicates the S & P Global Luxury Index, which is made up of the 80 largest international luxury goods and services companies. Note that the GLUX benchmark is quoted in USD. The ETF is quoted in Euro, but bears multiple currency effects given its geographical distribution. Despite its seniority (2008), the actual history of GLUX is brief because until February 2014 this ETF replicated the MSCI Insurance index.
The costs of this ETF are low (0.25%), in particular for a thematic tracker and the AUM are approximately €54m. Replication is indirect (via a swap) and the dividend method is capitalized. The tracking error of this ETF is very low (0.09% in 3 years).
Alternative ETFs: VCR (Vanguard USD), DC6 (Amundi)
Index profile
This index is rather broad, which is reinforced by the diversity of its sub-sectors. Of the c.51% that weigh the top 10 capitalizations, the luxury automobile (Daimler, BMW, Tesla) represents c.14%, spirits (Diageo, Pernod Ricard) c.7% and luxury (LVMH, Richemont) c.20%.
But GLUX also gives investors access to sectors such as luxury cruises (Carnival), clothing (Nike) and even casinos and luxury hotels (Las Vegas Sands).
All these companies share the common trait of being world leaders, with strong brands, generating high margins and regularly delivering growth levels well above the global GDP. They are more or less cyclical depending on the compartments - very cyclical for the auto part and hotels, not very cyclical for spirits - but have one thing in common, which is an important exposure to Asia and first of all China, while emerging countries become the main outlet, so India Brazil and Russia are gradually gaining importance.
The geographic distribution of GLUX makes it a good diversification tool on the theme of luxury. Europe accounts for almost 50% of the capitalization of the index, followed by the United States (38%). But Asia is also represented: Hong Kong, Japan and Korea together account for nearly 10%, Australia closes the ban with 1.4%. This index can be volatile, as evidenced by the sharp correction between April 2015 and February 2016 (-28%) slightly higher than that of the index stoxx600 (-26%), and at the end of 2018 but it is above all a growth theme related to the development of emerging economies, primarily Asian ones.
Technical analysis
Weekly analysis
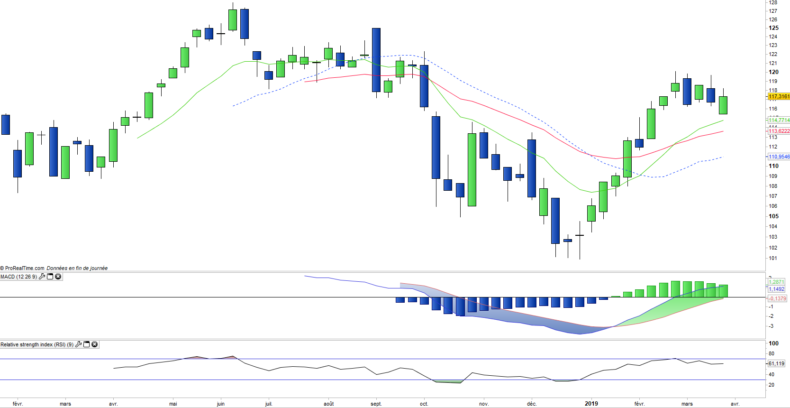
The weekly chart shows a pause phase that occurs after the validation of an upward trend reversal, which has been confirmed by the crossing of the EMAs13 and 26 and the return of all the oscillators in the positive zone. The pause seems logical after an extended rebound and restores the upside potential of the index for a next wave of hike towards 130 €.
Daily analysis
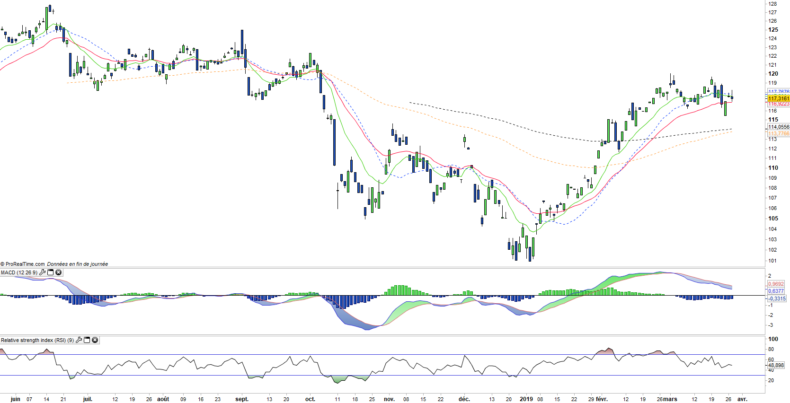
On the daily chart, we can distinguish the short-term stabilization phase which was enough for the technical indicators to turn down. However, while short moving averages (EMAs13 & 26) are flattening in the near term, there has been no bearish crossover for the moment and bullish momentum remains positive. A test of the EMA100 level is possible if the correction deepens but is not an obligation, before continuing the rise over a medium term horizon.
Theme
GLUX is a UCITS ETF, listed in EUR, which seeks to replicate the S&P Global Luxury net return index (80 companies)
Characteristics
| Inception date | 09/12/2008 |
| Expense ratio | 0,25% |
| Benchmark | Indice S&P Global Luxury |
| Ticker | GLUX |
| Issuer | Amundi |
| UCITS | Yes |
| EU-SD Status | Out of scope |
| Currency | € |
| Exchange | Euronext Paris |
| Assets Under Management | 54 M€ |
| Dividend | Capitalization |
| PEA (France) | Yes |
| SRD (France) | No |
| Currency risk | Yes |
| Number of holdings | 80 |
| Risk | 3/5 |
Country Breakdown
| USA | 38% |
| France | 22% |
| Germany | 12% |
| United Kingdom | 7% |
| Switzerland | 6% |
| Hong Kong | 4% |
| Others | 11% |
Sector breakdown
| Consumer discretionary | 82% |
| Consumer staples | 18% |
Top Ten Holdings
| LVMH | 8% |
| Daimler | 6% |
| Kering | 6% |
| Richemont | 6% |
| Nike | 5% |
| Tesla | 4% |
| Diageo | 5% |
| BMW | 4% |
| Pernod Ricard | 4% |
| Estée Lauder | 4% |


