iShares U.S. Transportation (IYT) - 06/07/2017
Short term strategy : Positive (100%) / trend +
Long term strategye : Positive (100%) / trend +
Characteristics of the ETF
The tracker IYT (iShares-BlackRock) tracks the US transport indexe consisting of a selection of 20 US-based stocks on transport, logistics and the cargo.
This is a very focused Index from a geographical point of view, mainly composed of US securities and quoted in USD, but more diversified on subsectors of activity since 29% of companies are specialised in the air freight & Logistics, like Fedex, 24% are railway companies, 23% are airlines, 17% of trucking and 6% of shipping. This sector is cyclical and therefore closely correlated to economic growth. The dynamics of margins also depends upon the price of fuel (therefore barrel price), while interest rates are also important for investment in transport fleets.
The sector is doing well due to sustained growth in the US, a still low rates environment while oil prices remain moderate. All the signs are positive and the index should continue its upward path. US growth should remain in a 2 to 2.5% range in 2017, while the rate hike should be a gradual, due to short term uncertainties linked to the policy of Donald Trump in respect with inflation and fiscal slippage. A stimulus infrastructure coupled with a massive taxes cut for businesses could extend the economic cycle already exceptionally long- for 2 more years according to some economists. Starting in 2017, the stabilisation of oil prices should allow a gradual restart of the industry which is a major consumer of freight (maritime, road and rail).
The expenses of IYT are relatively normative to 0.44% (Assets Under Management : 946 M$).
The historical performance of the ETF is satisfactory, +20.9% in 2016 and +6.6% since the beginning of the year and about 10% per year on average since its inception (2003) in USD, while the expenses remains relatively normative to 0.44%. The regularity of US growth has enabled this index to deliver an average high and consistent performance over the last 13 years (280%). The ETF is therefore a bet on continuing US growth, in a context of moderate and stable rates and energy prices, which should persist for structural reasons resulting from technology and globalization.
Monthly Data
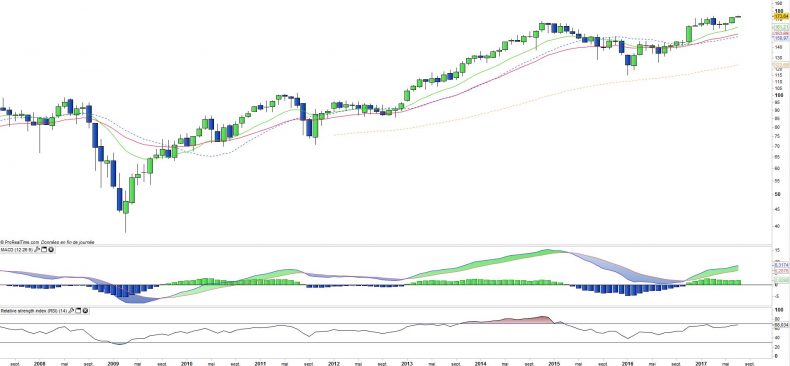
The monthly chart shows a rock solid bullish trend which is beginning a new positive wave after a pause in spring that have led IYT to test the M13 support in May, before rebounding strongly in June (+ 4%), a rather contrarian move as market were overall weakened by the fall in the energy and technology stocks. The ascending moving average and oscillators confirm the soundness of a this trend, while the 2015 summit to $168 has been exceeded, which is an element of additional strenght.
Données hebdomadaires
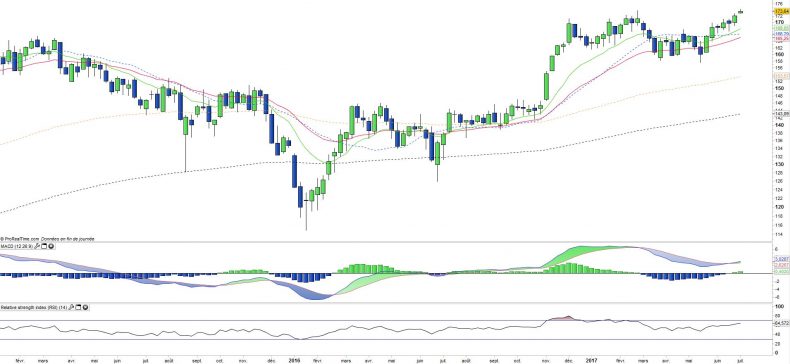
Weekly charts show the acceleration that is underway on IYT. The overtaking of the recent summit of February 2017 at $171 and the recent MACD upward crossing are the main signals. The spring pattern (V bottom), has been validated and new highs are expected shortly.
The oscillators are moving upward without being overbought which is encouraging for the continuation of the bullish trend in the medium term.
ETF Objective
Exposure to 20 U.S. airline, railroad, and trucking companies
Characteristics
| Inception date | 06/10/2003 |
| Expenses | 0,44% |
| Benchmark | Dow Jones Transportation Average Index |
| Issuer | iShares |
| Ticker | IYT |
| CUSIP | 464287192 |
| Currency | $ |
| Exchange | NYSE |
| Assets Under Management | 939 M$ |
| Dividend | Distribution |
| SRD | Non |
| Currency Risk | No |
| Number of Holdings | 20 |
| Risk | 3/5 |
Country Breakdown
| USA | 100% |
Sector Breakdown
| Air Freight & Logistics | 29% |
| Railroads | 24% |
| Airlines | 23% |
| Trucking | 17% |
| Marine | 6% |
Top Ten Holdings
| Fedex Corp | 14% |
| Norfolk Southern Corp | 8% |
| United Parcel Service | 7% |
| Union Pacific Corp | 7% |
| JB Hunt Transport Services | 6% |
| Kansas City Southern | 6% |
| Alaska Air Group | 6% |
| United Continental Holdings | 5% |
| Landstar System | 5% |
| Ryder System | 4% |


