Guggenheim Frontier Markets ETF (FRN) - 19/07/2017
Short term strategy : Positive (60%) / Trend +
Long term strategy : Positive (95%) / Trend +
Characteristics of the ETF
The ETF FRN (Guggenheim) tracks the Index BNY Mellon New Frontier, invested in 86 companies from emerging market countries, which are in the developing stage and therefore outside of major emerging investment zones.
The Index consists of all ADRs, GDRs and local securities of companies of Argentina, Bahrain, Bangladesh, Bulgaria, Croatia, Cyprus, Jordan, Kazakhstan, Kenya, Kuwait, Latvia, Lithuania, Nigeria, Oman, Pakistan, Panama, Romania, Sri Lanka, Tunisia, Ukraine, Viet Nam and Zambia which satisfy the following criteria : Minimum of 10 days traded each month for the 3 previous months and an average daily volume higher than or equal to 500000$. Market capitalisation adjusted by free float has to be greater than or equal to $ 250 million. The total weighting of all components for a given country is capped at 10% of the total weighting of the index, with the exception of Argentina, Kuwait and Nigeria, which are each capped at 15%. Adjustments are made to ensure that no Shares exceeds 10% of the index and, as regards the bottom 40% of the index, no security represents more than 4.5%.
In terms of sector allocation, we find unsurprisingly the Financial sector ( 35%), followed by Energy ( 12%), then followed by a large sector diversification on the other half of the capitalisation shared between Telecom (9.5%), industrials (8.9%), consumer goods (8.2%), raw materials (8%), real estate (6.3%), technology (6%) and utilities ( 3%).
Overall this ETF is particularly interesting because of its wide geographical and sectoral diversity, with 86 different companies. The expenses are relatively high at 1.28%, which can be explained by the numerous geographies involved and the lower liquidity of these developing markets, it is thereforemore a medium term investment than short-term trading vehicle. Assets Uneder Management : 68 $M.
Developing markets are generally more sensitive to the economic situation, the interest rate and the commodity prices. The fact that the FED is anticipating a moderate rise in interest rates and subsequently the recent weaknessthe dollar is therefore an excellent news for this index. The advent of technology also enables these developing economies to move directly to a service economy, withoutgoing through industrialization phase even if it has its limits.
Monthly data
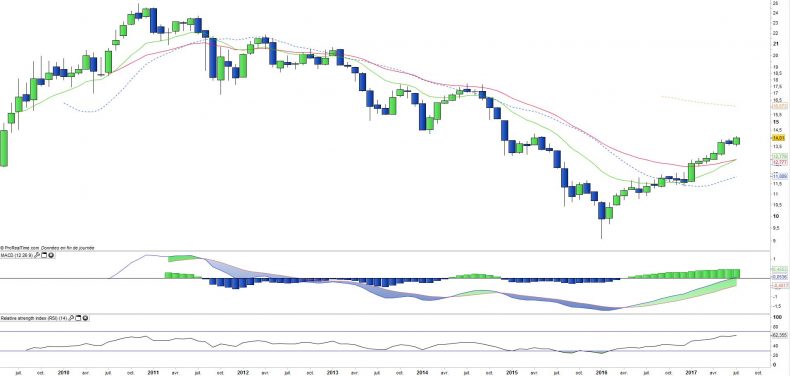
Analysis of the monthly charts shows an upward trend that has just begun after a long downward phase of 6 years which started in January 2011.
The EMA26x13 crossover should be validated this month (July) and, in our opinion, represents a true long-term signal, especially since it happens after a very long bearish phase.
The MACD should at the same time cross the zero line, which reinforces our bullish conviction.
Weekly data
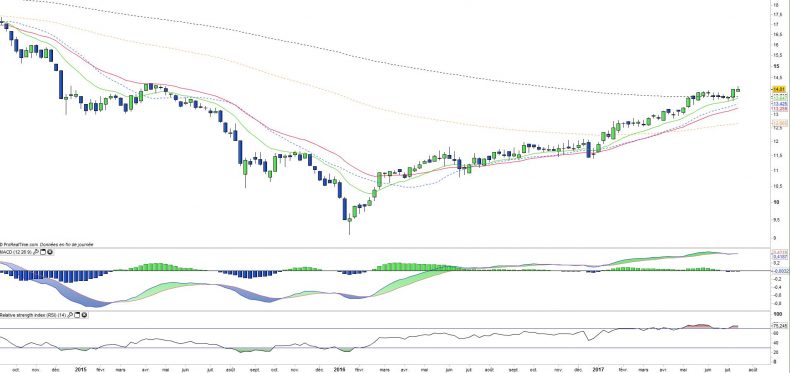
The Weekly analysis confirms our analysis positive. Here, the medium-term analysis is more positive than it seems. The MACD crossed negatively after a period of hesitation at the level of the M200exp, which has just been crossed clearly after a period of wavering at the EMA200 level which has just been crossed clearly. In fact all the indicators are positive and the MACD should rapidly give a bullish signal.
The medium-term analysis validates the long-term analysis perfectly.
ETF Objective
FRN seeks investment results that correspond generally to the performance, before the fund's fees and expenses, of the BNY Mellon New Frontier Index
Characteristics
| Inception Date | 12/06/2008 |
| Expenses | 1,28% |
| Issuer | Guggenheim |
| Benchmark | BNY Mellon New Frontier Index |
| Ticker | FRN |
| CUSIP | 18383Q838 |
| EU-SD status | Yes |
| Currency | $ |
| Exchange | NYSE ARCA |
| Assets Under Management | 68 M$ |
| Dividend | Distribution |
| Number of Holdings | 86 |
| Risque | 4/5 |
Country Breakdown
| Kuwait | 14% |
| Nigeria | 13% |
| Argentina | 10% |
| Pakistan | 10% |
| Morocco | 9% |
| Kenya | 8% |
| Romania | 6% |
| Oman | 5% |
| Others | 25% |
Sector Breakdown
| Financials | 35% |
| Energy | 13% |
| Telecom Services | 10% |
| Industrials | 9% |
| Consumer Staples | 8% |
| Materials | 8% |
| Real Estate | 6% |
| Information Technology | 6% |
| Utilities | 3% |
Principales composantes
| Mercadolibre Inc | 6% |
| Copa Holdings SA | 6% |
| Guaranty Trust Bank | 5% |
| Aroundtown Property Hold. | 4% |
| National Bank of Kuwait | 3% |
| Banca Transylvania SA | 3% |
| Safaricom Ltd | 3% |
| Kaz Minerals PLC | 3% |
| Nigerian Breweries PLC | 3% |
| Vietnam Dairy Products | 3% |


