Lyxor Euro Stoxx50 Net Return (MSE) - 07/08/2017
Short term strategy : Negative (40%) / Trend +
Long term strategy : Positive (95%) / Trend =
Characteristics of the ETF
The Euro Stoxx50 Index is composed of the 50 largest stocks in the eurozone which are selected according to their market capitalisation, liquidity and sector representativeness.
The index seeks to respect a weighting by country and by economic sector that is a maximum reflection of the economic structure of the eurozone area. This index is dominated by the Franco-German couple, which represents about 70% of the index capitalisation, while the remaining 30% of the index, is mainly consisting in companies coming from the southern European countries (mainly Italy and Spain) and the Benelux.
The 10 largest holdings represent approximately 35% of the index and are large companies in the order of 100 bn€, market capitalization including 6 German companies (Siemens, SAP, Bayer, BASF, Allianz and Daimler) and 2 French (Total and Sanofi). The index is fairly balanced from a sector perspective, most of which is financials (24%), followed by industry (14%), cyclical consumer goods (11%) and durable goods (11%) and healthcare (10%).
With regard to euro area stocks, there is no direct currency risk, however, with respect to large and worldwide based companies, there is a sensitivity to the euro/dollar change. The Euro Stoxx50 is representative of the eurozone economy as a result of its sector weighting, which makes the share of the energy sector lower than in some national indexes (such as the CAC40), while the financial sector (banks + Insurance) remains a key Sub-Fund with 22% of the weighting while below the weight it represents in the Italian or Spanish indexes (c.33%).
MSE replicates the Euro Stoxx50 (physical replication of the index) with low expenses rate (0.2%) and its liquidity amounts to 7 430 M€. The volatility of the Euro Stoxx50 is rather lower than that of national indexes, due to geographical diversification, lack of sector bias and the greatest inertia due to the size of market capitalisations.
The Euro Stoxx50 recorded a slight increase of 0.7% in 2016, while the rise reached 6,6% in 2017 (+8,1% for the Stoxx600 led by Switzerland and the Nordic countries). Looking at the euro Stoxx50 in comparison with the Stoxx600, it is a much more concentrated index focused on the core of the eurozone as a result of the absence of the UK, Switzerland and the Nordic countries, and on the large market capitalisations too. The political cycle has been particularly favourable, with the Liberals victory in the Netherlands and France. Italy is still to vote in 2018 and Germany in September.
The Eurostoxx50 was driven by the technology sector and financials that benefit from the rate hike. However, in recent weeks the Eurostoxx50 was penalized by the sharp rise of the Euro against the dollar to 1.18 and against other currencies (Sterling, Swiss Franc) and despite higher corporate results above expectations in Q2 2017 . Macroeconomic issues (rates and currencies) are now at the forefront with the ECB again in the first line.
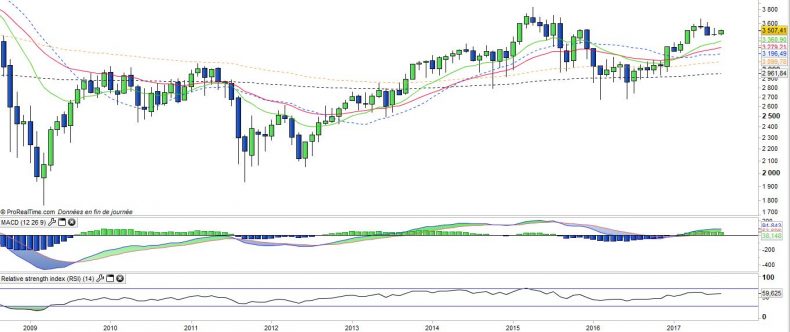
Monthly data
Analysis of the monthly charts shows a corrective movement that has been going on for a few months, within a bullish trend characterized by both rising moving averages, a positive MACD which is above its zero line. The August monthly candlestick is drawing a rebound likely to end this correction but which will have to be confirmed in closing.
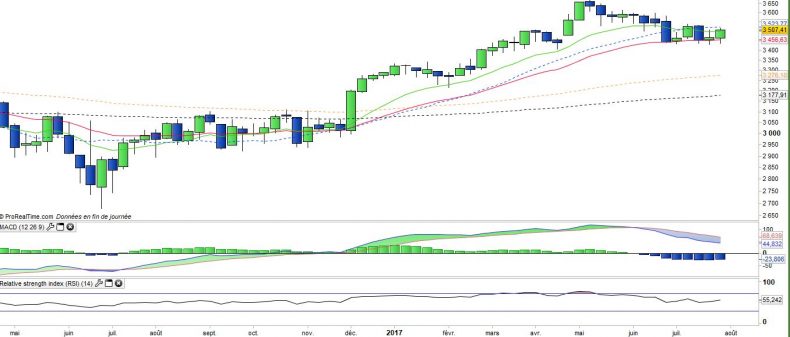
Weekly data
The analysis of the weekly charts shows us where this rebound in progress stand. In fact it essentially consists of the bullish candlestick of last week, which itself formed in a few hours Friday following a favorable US unemployment data. This is an encouraging signal, but linked to an event, which will have to be confirmed in the coming weeks to be validated.
This signal is for the moment rather isolated since the MACD remains negative. It is therefore advisable not to buy this signal too quickly.
ETF Objective
MSE is an ETF which replicates the performance of the Euro Stoxx50 benchmark index, which includes the 50 largest European companies in the Euro zone.
It is therefore a global index that is representative of the main countries of the euro zone, with a significant weight for the Franco-German couple (70%).
Characteristics
| Inception date | 19/02/2001 |
| Expenses | 0,20% |
| Benchmark | Euro Stoxx 50 Net Return |
| Issuer | Lyxor |
| Ticker | MSE |
| ISIN | FR0007054358 |
| UCITS | Yes |
| EU-SD Status | Out of Scope |
| Currency | € |
| Exchange | Euronext Paris |
| Assets Under Management | 7 430 M€ |
| Replication Method | Direct (Physical) |
| Dividend | Capitalisation |
| PEA | Yes |
| SRD | Yes |
| Currency Risk | No |
| Number of Holdings | 50 |
| Risk | 3/5 |
Country Breakdown
| France | 36% |
| Germany | 33% |
| Spain | 11% |
| Netherlands | 7% |
| Italy | 5% |
| Belgium | 3% |
| Others | 7% |
Sector Breakdown
| Financials | 24% |
| Industrials | 14% |
| Consumer discretionary | 11% |
| Consumer staples | 11% |
| Health Care | 10% |
| Information Technology | 7% |
| Energy | 6% |
| Others | 17% |
Top Ten Holdings
| Total | 5% |
| Siemens | 4% |
| Sanofi | 4% |
| Bayer | 4% |
| SAP | 4% |
| Banco Santander | 4% |
| Allianz | 4% |
| Unilever | 3% |
| AB Inbev | 3% |
| BNP | 3% |


