Lyxor ETF Australia Spasx 200 (AU2) - 08/08/2017
Short term strategy : Negative (20%) / Trend +
Long term strategy : Positive (60%) / Trend +
Characteristics of the ETF
ETF AU2 (Lyxor) replicates the S & P / ASX-200 index, which is composed of the 200 largest Australian stocks, selected according to the size of their market capitalization.
This index covers 80% of the market capitalization of the country, it is therefore a very good proxy of the Australian economy. The top 10 stocks are mainly composed of banks, while the financials constitute 38% of the index, the other compartment strongly represented is mining / materials for 15%, which includes the giant BHP Billiton.
We see Australia as a growth driver. It is the only country in the OECD that has not experienced a recession during the financial crisis as the economy has grown for 25 consecutive years. Growth reached 2.4% in 2015, slightly lower than in 2014. The Australian dollar declined in 2015 and the fall in coal and iron ore prices had a strong impact on exports. The trend was more or less similar in 2016 (+ 3%). This good performance can be explained by the broadening of the economy, following a relative economic slowdown due to lower Chinese demand for exports, particularly minerals. The mining sector accounts for about 20% of GDP, but investment has declined due to falling prices and could gradually recover.
Australia has other strengths: a massive export of agricultural products, strong domestic demand and a robust financial sector. Australia is accelerating its integration with the Asia-Pacific region, while the country's main trading partners are Asia (China leading), the United States and the European Union. Asia's share of trade with Australia is growing steadily.
By 2014, Australia had signed a free trade agreement with China, in line with that agreement Australia joined the Asian Investment Bank for Infrastructure established by China in 2015. Investing in the Australian index indirectly focuses on the development of the Asia (and China) zone through an Anglo-Saxon liberal state, which is highly financialized and a lot of natural resources while its Population is approximately only 25 million inhabitants. Australia's GDP is about $ 1,300 billion and is about the same as Spain or Russia, but GDP per capita is one of the highest in the world.
The costs of this ETF are in the higher than average of our sample at 0.4%. The index is fairly volatile, but it is growing steadily and has risen by 13% in 2016.
In 2017 the situation is more difficult and the index is only 1.6% higher since the beginning of the year because of the sluggishness of the banking sector (Commonwealth Bank of Australia: -1% and Westpak Banking -2%). However, the current rebound in the mining sector is encouraging (BHP Billinton + 12% since July first) while the Australian central bank (RBA) has announced that it kept its rates at 1.5%, at the same level since a year. As a result, the Australian dollar, which had risen sharply in anticipation of a hardening, declined and the ASX 200 closed + 0.91% in the wake of the news. The keeping of a fairly accommodative policy on the part of the RBA supports the growth of the country.
Monthly data
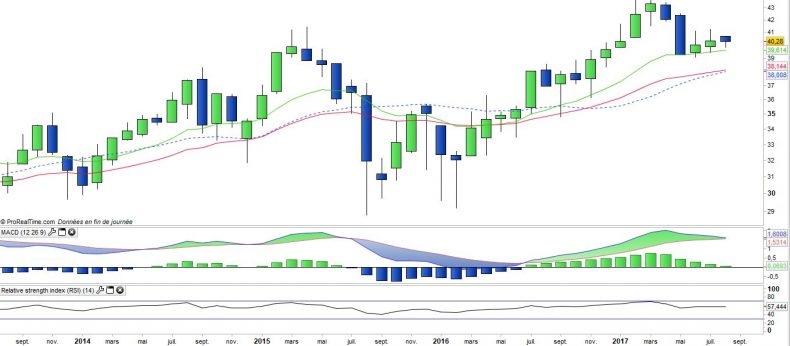
The analysis of the monthly charts shows that the correction of the big wave of rise of 2016 is done, and has come to stop on the support of the M13E. Prices are now stabilized and a new upswing may begin shortly. The oscillators did not turn down during the H117 correction, but threaten to do so if there is no new bullish impulse.
The index is therefore at the crossroads, but a bullish exit is expected.
Weekly data
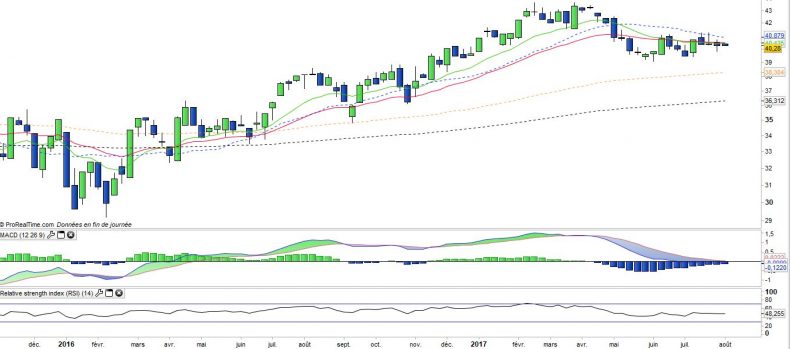
The analysis of the weekly charts shows a rather uncertain situation in the short term. The 13 & 26 moving averages are flattening and joining, while the prices are locked between the EMA20 which acts as a resistance and the EMA100 which acts as a support. The low price volatility for several weeks is probably temporary and we expect a more directional phase in the coming weeks.
A bullish crossover of the M20E (41 €) would be a positive signal with an attractive risk / reward.
ETF Objective
AU2 is a UCITS compliant ETF that aims to replicate the Australian benchmark index S&P / ASX 200 Net TR (200 companies)
Characteristics
| Inception date | 26/03/2010 |
| Expenses | 0,40% |
| Benchmark | S&P asx 200 |
| Issuer | Lyxor |
| Ticker | AU2 |
| ISIN | LU0496786905 |
| UCITS | Yes |
| EU-SD Status | Out of Scope |
| Currency | € |
| Exchange | Euronext Paris |
| Assets Under Management | 70 M€ |
| Replication Method | Indirect (via a swap) |
| Dividend | Distribution |
| PEA | No |
| SRD | Yes |
| Currency Risk | Yes |
| Number of Holdings | 200 |
| Risk | 3/5 |
Country Breakdown
| Australia | 96% |
| United Kingdom | 2% |
| Others | 2% |
Sector breakdown
| Financials | 39% |
| Materials | 17% |
| Industrials | 7% |
| Real Estate | 7% |
| Health Care | 7% |
| Consumer Staples | 7% |
| Consumer Discretionary | 5% |
| Others | 11% |
Top Ten Holdings
| Commonwealth Bank of Australia | 10% |
| Westpac Banking | 7% |
| Austr & NZ Banking Group | 6% |
| National Australia Bank | 5% |
| BHP Billiton | 5% |
| CSL Ltd | 4% |
| Telstra Corp | 3% |
| Westfarmers | 3% |
| Woolworths Ltd | 2% |
| Macquarie Group Ltd | 2% |


