SPDR ETF US Health Care Services (XHS) - 09/08/2017
Short term strategy : Negative (10%) / Trend -
Long term strategy : Positive (90%) / Trend -
Characteristics of the ETF
The XHS ETF (SPDR) replicates an index consisting of 55 US health care specialists (35%), Healthcare Facilities (27%),Managed Health Care (24%), and Heath Care Distributors (15%).
It is a highly geographically diversified index, mainly composed of US stocks and quoted in USD, but rather diversified in terms of sub-sectors of activity and the number of companies The top 10 stocks only account for 26% of the index.
The first capitalization, Teladoc weighs only 3.2% followed by Acadia Healthcare Company (2.9%). This sector has the particularity of being fairly defensive because it depends very little on economic growth. However medical care in the US is quite expensive and not always fully covered by insurance, so the sector could be potentially impacted by a severe and lasting crisis. Health is also a regulated market and the administration can influence the services market by legislating on taxes and the health insurance system.
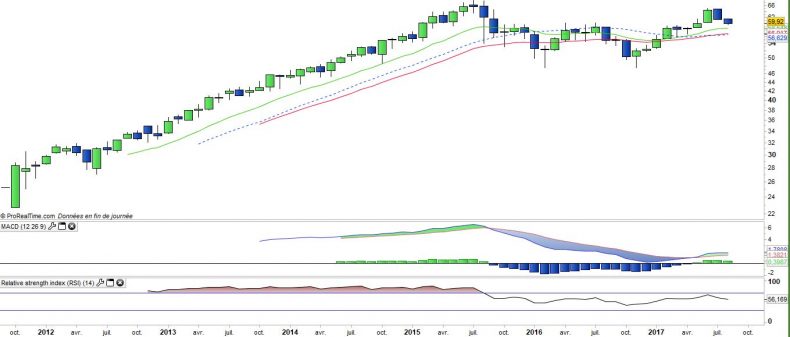
The historical performance of XHS is very satisfactory and has risen by 160% since its inception in 2012, performance was weak in 2016 (-8.6%) due to political uncertainties regarding US health policy, but XHS is progressing from almost 14% since the beginning of the year, while costs remain fairly conventional at 0.35%.
Defensive sectors have been somewhat neglected since October, leaving them to cyclical sectors and banks that benefit from expectations of tax cuts, financial deregulation and infrastructure investments. But the sector is mostly impacted at the moment by the lack of visibility on the evolution of the Medicaid, while Donald Trump has just failed a second time to validate its reform of the Obamacare after the US congress, yet a Republican majority rejects the amendments. This increases the uncertainty about what the next healthcare reform will be, with the fear that an in-depth change of the Obamacare will occur this time, which would penalize the healthcare institutions.
Monthly data
The long-term chart shows that the change in upward trend after nearly 18 months of correction is still valid despite a very deep consolidation started in July. Prices are moving rapidly towards the EMA13 on which a rebound should be organized.
The oscillators flatten, but are still in positive territory, which suggests a resumption of the upward trend.
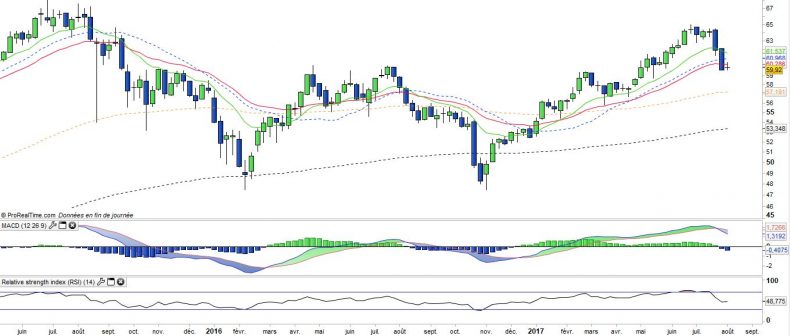
Weekly data
The weekly chart shows that a fairly violent correction crossed downwards the EMA13 and 26 by forming two large negative candlesticks. However, important supports are now nearby, such as the EMA100 located at $ 57.2. The oscillators have turned down, like the MACD or the RSI but the residual downside potential appears rather low.
This week is going to be key to determine if selling pressure weakens or if a 3rd negative candlestick completes the pattern.
ETF Objective
XHS is an ETF which seeks to replicate the total return performance of S&P Health Care Services Select Industry Index
This index provides exposure to the following sub-industries: Health Care Distributors, Health Care Facilities, Health Care Services, and Managed Health Care
Characteristics
| Inception date | 28/09/2011 |
| Expenses | 0,35% |
| Issuer | SPDR |
| Benchmark |
S&P Health Care Services Select
Industry Index
|
| Code/Ticker | XHS |
| ISIN | US78464A5737 |
| UCITS | No |
| EU-SD Status | Yes |
| Currency | Dollar |
| Exchange | NYSE |
| Assets Under Management | 102 M$ |
| Currency Risk | No |
| Number of Holdings | 55 |
| Risk | 3/5 |
Country Breakdown
| United States | 100% |
Sector Breakdown
| Health Care Services | 35% |
| Health Care Facilities | 27% |
| Managed Health Care | 24% |
| Health Care Distributors | 15% |
Top Ten Holdings
| Teladoc Inc | 3% |
| Acadia Healthcare Company | 3% |
| HealthEquity | 3% |
| BioTelemetry | 3% |
| HCA Healthcare | 3% |
| Tenet Healthcare | 3% |
| AmerisourceBergen | 2% |
| Molina Healthcare | 2% |
| Laboratory Corp of America Holding | 2% |
| Diplomat Pharmacy | 2% |


