Amundi Euro Corporate Bonds UCITS - CC4 - 30/08/2017
Short term strategy : Positive (90%) / Trend +
Long term strategy : Positive (70%) / Trend +
Characteristics of the ETF
The ETF CC4 (AMUNDI ETF EURO CORPORATES UCITS) aims to replicate the Markit iBoxx Euro Liquid Corporates Top 75 Mid TCA index.
This ETF allows for diversified exposure to approximately 75 corporate bonds selected on the basis of liquidity criteria and denominated in euro. The first 10 holdings of the index represent just under 20% of the capitalization and are made up of major international companies such as Vodafone, Deutsche Telecom, IBM or Verizon. There is great diversification in the sectors of activity, with 57% of industrial or technological companies and 43% of financial companies. At the geographical allocation level, this ETF also benefits from a great diversity on all the continents but concentrated on the developed countries: the USA represent 23% of the selection, the United Kingdom and the Netherlands 16%. Europe accounts for the bulk of the allocation, but some Asian countries (Japan 1.4%), Central America (Mexico 2.1%) or Saudi Arabia (1.4%) are marginally present.
Corporate bonds are relatively low risky in periods of low inflation and moderate interest rates, and are much less sensitive to economic fluctuations than equities. While a company's share may lose a significant portion of its value in the event of disappointments in its results, corporate bonds become volatile only if there are questions about their solvency, (such as the financial crisis of 2008) or specific problems that can lead to the bankruptcy of a company (Kodak, Enron, General Motors etc.), which is rare when we talk about large Groups.
High-quality corporate bonds (as opposed to high-yield bonds), as is the case with CC4, often behave as safe haven for investors at a time when risk aversion and volatility prevail in equity markets. The macroeconomic context remains favorable for the time being: the rise in interest rates is expected to remain moderate in the coming months, while inflation remains weak due to structural factors (innovation, services, globalization). A good timing for CC4.
While the European equity markets have entered into a correction phase since May, CC4 is an interesting alternative and not very risky. The quality of the companies making up the index is high, with 18% AA ratings, 39% A rating, 42% BBB ratings and 1% BB ratings. The maturity of the bonds is mainly between 2 and 10 years, with a peak at 5 years (38% of the bonds).
The costs of this ETF are moderate to 0.16% and the mode of replication is synthetic, the size of the AUM is reasonable to about € 400m. CC4 rose by nearly 4% in 2016 and by 1% in 2017, changes / progressions are generally much less marked than in equity markets. On the month of August CC4 rose by 0.58% against -2.25% for the Stoxx600NR.
Données mensuelles
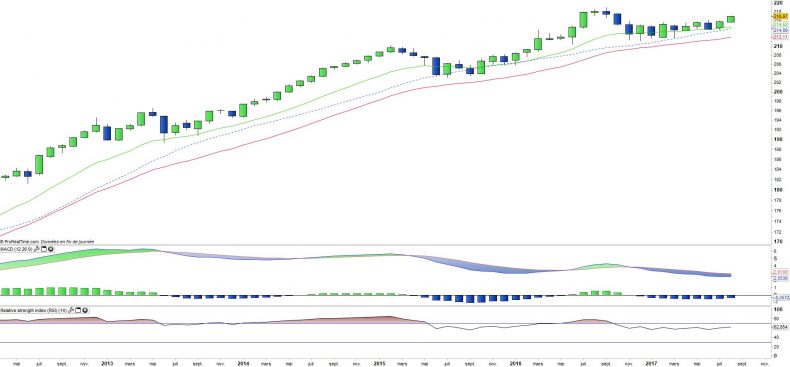
The analysis of the monthly charts shows a very strong upward trend. A new wave of rising is in formation, with monthly candlesticks that show new highs especially in August, which allows this index to get rid of the trading range active since the beginning of the year.
It remains to the MACD to confirm this positive orientation so that the picture is complete.
Données hebdomadaires
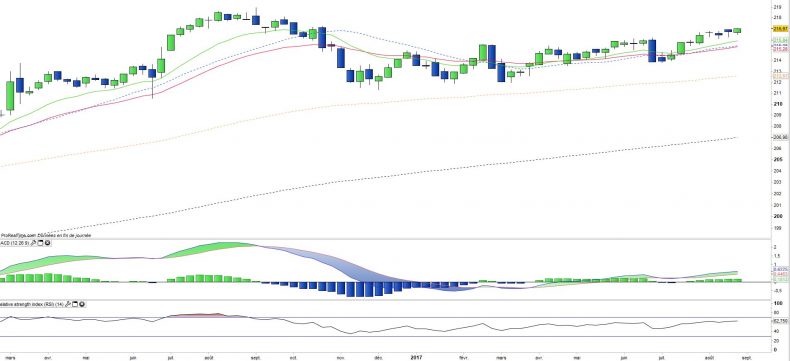
The analysis of the weekly charts shows that an upward acceleration is in progress. The moving averages turned upward again, as are the oscillators, which have all become bullish.
Prices are now moving toward the peak of 2016 at around € 219, which could be exceeded soon and increase the bullish potential for CC4, with a probable acceleration to the key.
Objectifs de l’ETF
To benefit from an exposure to 75 most liquid euro corporate IG bonds
Characteristics
| Inception date | 22/06/2009 |
| Expenses | 0,16% |
| Issuer | Amundi |
| Benchmark | Markit iBox Euro Liquid Corporates Top 75 Mid TCA Index |
| code/ticker | CC4 |
| ISIN | FR0010754119 |
| UCITS | Yes |
| Curency | € |
| Exchange | Euronext |
| Assets Under Management | 480 M€ |
| Replication Method | Indirect (swap) |
| PEA | No |
| SRD | No |
| Dividend | Yes |
| Currency Risk | No |
| Number of Holdings | 75 |
| Risk | 3/5 |
Country Breakdown
| USA | 22% |
| United Kingdom | 16% |
| Netherlands | 16% |
| Italy | 9% |
| Germany | 8% |
| Switzerland | 4% |
| France | 4% |
| Australia | 3% |
| Ireland | 3% |
| Luxembourg | 3% |
| Others | 11% |
Breakdown by rating
| AA | 18% |
| A | 39% |
| BBB | 42% |
| BB | 1% |
Top Ten Holdings
| CS 1.375% 11/19 | 2% |
| VZ 2.375% 2/22 | 2% |
| TEVA 0.375% 07/20 | 2% |
| VOD 2.20% 08/26 | 2% |
| DT 0.625% 03/04/23 | 2% |
| ACAFP 2.625% 3/27 | 2% |
| HSBC 1.5% 15/03/22 | 2% |
| IBM 1.875% 11/20 | 2% |
| HUWHY 1.375% 10/21 | 2% |
| BSY 1.5% 9/21 | 2% |


