Lyxor ETF Stoxx600 Telecom - TEL - 04/10/2017
Short Term strategy : Negative (10%) / Trend =
Long Term strategy : Negative (0%) / Trend =
Characteristics of the ETF
The Lyxor TEL ETF (UCITS) was created in 08/2006, is listed in Euro on Euronext and tracks the Stoxx600 Telecom Europe index, which is composed of the 22 main European stocks in the sector.
It should be noted that non-euro area stocks represent 45% of the index, 31% of which is in sterling, which represents a potentially significant volatility factor for the index.
The cost of this ETF is 0.3% in the average of our selection and the AUM is approximately € 133m. The replication method is indirect (via a swap) and dividends are capitalized.
Alternative ETFs: EXV2 ( iShares in Euro), CT5 ( Amundi in Euro), TELW ( Lyxor in GBP)
Index & components
The TEL (Lyxor) tracker allows investors to access a basket of 22 large European telecom stocks with characteristics of being mainly English and German (50% of the sample).
These are very large market capitalisations (between € 10 and € 80bn), which have a turnover consisting mostly of a strong local base with defensive characteristics but with intense competition that drives prices, capital intensity due to investments in fixed and mobile networks. It should also be noted that Vodafone, which represents 20% of the index, is a company that has become highly internationalized and pursues a double strategy as a cable operator and world leader in mobile. European companies have generally stabilized their dividend payments thanks to a greater control of their cash flows through the control of Investments and especially the reduction of operating expenses. The payment of high dividends (about 4% yield) is an attribute of the sector that makes a large part of its attractiveness on the stock market.
The major European operators have invested heavily in optical fiber and content in order to eventually have greater control over selling prices. Telecoms are an area where there is good medium-term visibility (no rupture or "uberisation" on the horizon), the players in place have already sharply lowered the price of subscriptions.
The currency risk exists because of the high proportion of UK stocks in the index, and therefore mainly focus on the € / £ parity. The volatility of this index has historically been fairly moderate, but has tended to increase in recent years as a result of price pressure, the halt of dividends payment by certain companies (eg Telecom Italia) and too high leverage.
Latest developments
In 2016, the TEL tracker declined by 12.6% in marked underperformance relative to the Stoxx600 (+ 1.7%), which reversed a similar increase in 2015. Since the beginning of 2017 the sector is almost stable at + 1%.
The sector is currently cheap at around 14x profits 2018, while players in southern Europe have a significant discount to catch up, due to their exposure to South America and their heaviest debt. The 2017 results are so far encouraging with a slight increase in margins, reflecting the efforts on costs and a return on the heavy investments made in particular in fixed / fiber. These encouraging results reinforce the dividends that could resume the upward trend and justify an increase in valuations.
4G / then 5G and fiber will play an important role in the reflation of the sector. However in the short term, there is a lack of catalyst bulls, and the market is much more focused on growth and cyclical values to play the economic reversal in Europe. The decline in the pound has also had a strong negative impact since early 2016, and British stocks are under pressure (particularly British Telecom: -19.9% since January).
There is no real positive catalyst to be expected in the short term on the sector.
Monthly data
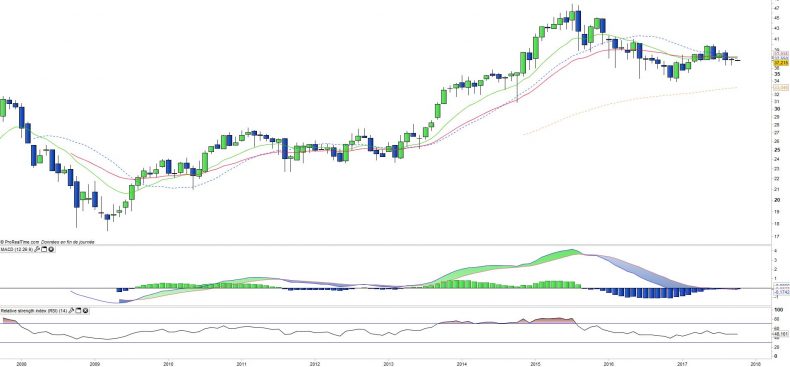
The monthly chart shows a long-term trend very hesitant. After breaking the bearish trend line formed from 2015, prices waver around the moving averages without any real direction. The moving averages are flat and are joined not far from current prices and the oscillators do the same, like the MACD completely flat.
There is no trend on TEL, which seems completely unheeded for now by the market.
Weekly data
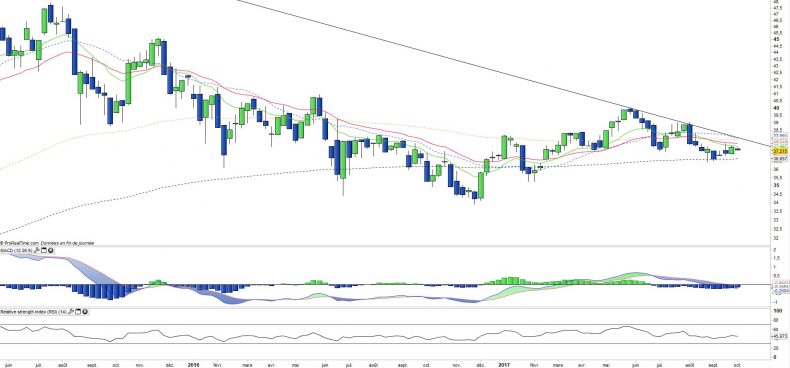
On the weekly chart, a short-term bearish trend can be observed, which is characterized by a downward line. At the same time, the prices do not seem in position to break the EMA200 which plays the role of support. The oscillations between these two bounds are less and less strong and the volatility seems to have completely disappeared.
It seems preferable to wait for a clear signal, coupled with a renewed volatility to take a position on this ETF.
ETF Objective
TEL is a UCITS compliant ETF that aims to track the benchmark index Stoxx Europe 600 Telecommunications Net Return (22 companies)
Characteristics
| dInception date | 25/08/2006 |
| Expense ratio | 0,30% |
| Issuer | Lyxor |
| Benchmark | Stoxx 600 Telecom |
| Ticker | TEL |
| ISIN | FR0010344812 |
| UCITS | Yes |
| EU-SD STatus | Out of Scope |
| Currency | € |
| Exchange | Euronext Paris |
| Dividend | Capitalisation |
| Assets Under Management | 133 M€ |
| PEA (France) | Yes |
| SRD (France) | Yes |
| Currency Risk | Yes (£/€) |
| Number of Holdings | 22 |
| Risk | 3/5 |
Country Breakdown
| United Kingdom | 31% |
| Germany | 19% |
| Spain | 14% |
| France | 10% |
| Netherlands | 6% |
| Sweden | 5% |
| Others | 15% |
Sector Breakdown
| Telecom Services | 97% |
| Consumer Discretionary | 3% |
Top Ten Holdings
| Vodafone | 20% |
| Deutsche Telekom | 15% |
| Telefonica | 13% |
| BT Group | 9% |
| Orange | 9% |
| Telenor | 4% |
| Swisscom | 4% |
| Telia | 4% |
| Altice | 3% |
| Konincklije | 3% |


