The ETF Lyxor CRB (Commodities) was created in 01/2006, and is listed in Euro on Euronext and seeks to replicate the performance of the Thomson Reuters / Core Commodity benchmark CRB Total Return composed of 19 commodities quoted in USD.
It is an index of commodity futures calculated and published by Thomson Reuters. There is a risk linked to the Euro - USD exchange rate in the event of a fall in the dollar.
The cost of this ETF is 0.35% and the AUM is of approximately 864M €.
Replication is indirect (via Swap) and there is a policy of capitalization of interests.
Alternative ETFs: ICOM (Ishares in USD)
Index & components
The ETF CRB is composed of a basket of 19 very various raw materials, ranging from oil to corn, to gold and copper. These commodities are mainly processed in US markets, with a reference price in US $. Our ETF therefore involves currency risk, in the event of a significant change in the € / $ parity, which implies that the risk would be a sharp depreciation of the dollar against the Euro, which does not seem likely as a cycle of rising US interest rates is underway and US growth remains stronger than the European so far. On the other hand, it should be noted that energy accounts for nearly 40% of the index, just under 25% for WTI oil (23.2%), which has stabilized for 18 months after a sharp decline due to oversupply linked to shale oil. Oil is therefore important for the evolution of the index but does not explain all the performance of the index. We do not expect a strong evolution of the crude in the next 2 years that should continue to evolve within a trading range between $ 40 and $ 60. What is interesting to note in this index is the decorrelation between its components: the basic metals (copper, nickel, aluminum, etc.) are linked to growth in emerging countries such as China while the price of agricultural products are influenced by weather or other factors that may affect the volumes produced (wars, sanitary problems, parasites, etc.). What is interesting to note is that most of the commodities that make up the index are at a relatively low level for very different reasons but this is not necessarily sustainable over the medium term. Moreover, the technology could have a long-term negative structural impact on the prices of these raw materials (electric cars on petroleum, transgenic on agricultural products, etc.) and positive on others, as for copper (electric cars, renewables…). Sales pressure is exerted on a number of agricultural raw materials that suffer from structural overcapacity. The metal and mining sector, which has been strong for several months, appears to have entered a phase of moderate expansion due to sustained global demand and some capacity adjustments from China.
Latest developments
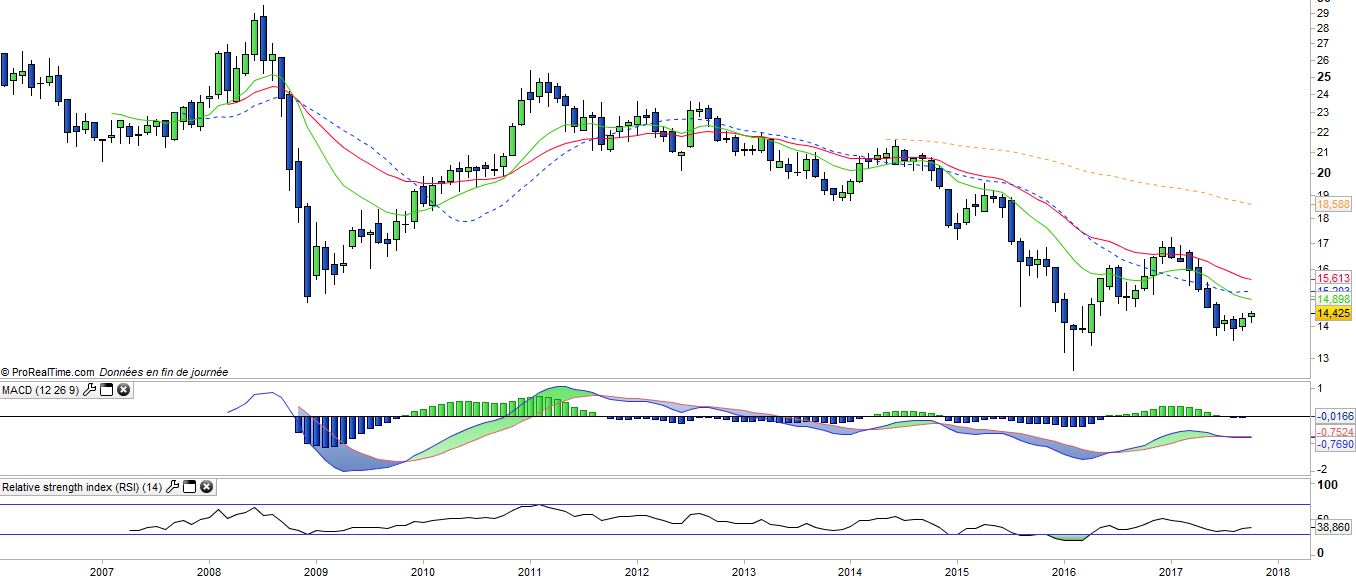
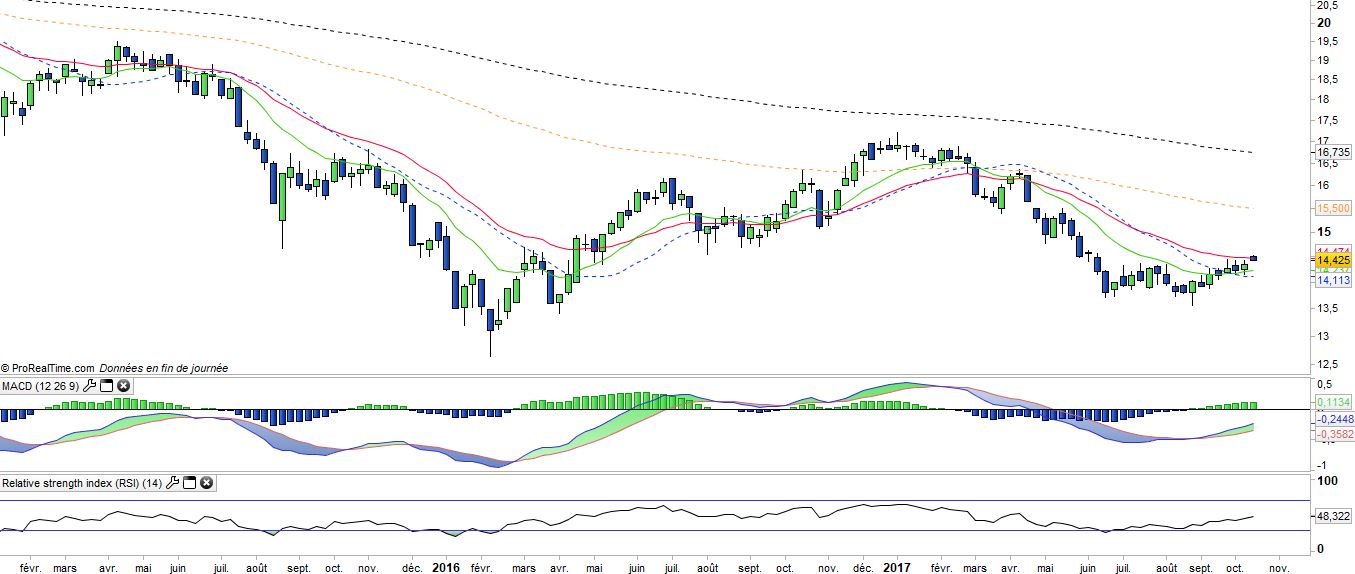
After a rise of 13.4% in 2016 due to the oil rebound, CRB is down 14.2% in 2017 and is therefore at about the level of end-2015.
WTI remains for the time being in its mid-term trading range of between 45 and 59 $, well oriented in the short term due to the Iraqi intervention intended to regain control of the Kurdish oil fields and the renewed tension between the US and Iran.
The real engine of CRB is undoubtedly the industrial metals (Copper, Nickel, Aluminum) which benefit from the world GDP growth, a reduction of the chinese capacities and some technological drivers (renewable, electric car) but this subsegment weigh only 13% of the index which implies a too limited traction.
The main problem of CRB remains the agricultural raw materials subsegment which weigh 40% of the index and which is under pressure (in particular soybean, sugar, corn, wheat and cocoa) due to overcapacities sometimes accentuated by GMOs as well as regulation such as the liberalization of the sugar market in Europe. The prices of these agricultural materials have been declining for years, (10 years for wheat), due to productivity gains, plethoric stocks and increasing yields. Capacity adjustments could eventually occur, but these are at for the moment dramatic downward long term trends. Thus, CRB can only really take off if the agricultural raw materials find a floor.