Guggenheim China Small Cap ETF (HAO) - 06/04/2018
Short Term strategy: Positive (90%) / Trend +
Long Term strategy: Positive (95%) / Trend =
Characteristics of the ETF
The HAO ETF (Guggenheim) initiated in 01/2008 aims to provide exposure to small-cap companies listed in China with a float-adjusted market capitalization of up to $ 1.5 billion and a minimum of $ 200M.
At least 90% of the total assets are invested in common shares, American Depositary Receipts ("ADR"), American Depositary Shares ("ADS"), Global Depositary Receipts ("GDR") and International Depositary Receipts ("IDR"). Only shares open to foreign investors are included in the index. These include all Hong Kong-listed securities, including Chinese H and Red Chips, and N-Shares traded in New York and their counterparts traded in other foreign markets. Chinese A Shares and Chinese B Shares cannot be included in the Index. This index provides exposure to smaller, entrepreneurial and non-public companies in China that fit the Alpha Shares China Small Cap Index. The index is rebalanced and reconstituted annually.
This ETF is quoted in USD on NYSE and bears a 0.90% fee with AUM of approximately $90M. The replication method is straightforward and there is a dividend policy on an annual basis (usually in December).
Alternative ETF: ECNS (iShares in USD)
Index & components
HAO is composed of 329 values, so it is a fairly deep index and very diversified from a sectoral point of view.
The industrial sector accounts for 17.1% of the capitalization, followed by IT (14.5%), real estate (16.6%), consumer discretionary (14.3%) and the mining sector (9.5%). It is interesting to note that financials represent only 6.2% of the index. The first capitalization of the index weighs only 2%, it is a real estate company (Sunac China Holdings), while the first 10 capitalizations represent only 11%, the risk is therefore very diversified.
Historically, small and medium-sized enterprises in China have contributed 50% of national tax revenues, 60% of GDP and 80% of employment, so they represent a good proxy for the Chinese economy. This is driven by fundamental trends, such as the digitization of the economy, which is growing rapidly, while e-commerce sales are worth € 701bn (Chinese statistics) and already represent half of the world total. Understand that in the US, 70% of Internet users are over 30, while in China it is the opposite 70% are under 30 years old. Mobile payment is also growing strongly, and online payments in China reached $ 5.5 trillion in 2016, almost fifty times more than the $ 112 billion spent on mobile in the United States, thanks in part to Alibaba's electronic wallets (Alipay) and Tencent (WeChat Pay), this new market is rapidly transforming the consumer behavior in China.
The economy seems more and more supported by services and consumption, and the Internet is speeding up this process. China is aiming for an upscaling of its economy and is automating a thigh speed; it has already become a leader in robotics and artificial intelligence.
Chinese consumption has been rising since the beginning of the decade, rising from 35.4% in 2010 to almost 39% of GDP in 2016. However, many sectors, from heavy industry to energy and telecommunications, remain dominated by state-owned enterprises that are often deficient and unproductive, they are called "zombie companies", kept alive only with virtually unlimited credit, and accounting for 14% of loans distributed to industry in 2016, compared with 4 % in 2011. The maintenance of these structures is reflected in a worrying expansion of public and private debt, which amounts to nearly 250% of GDP.
Small caps are therefore an interesting way to play China's modernization, and we expect a growing weight of technology and services in the components of the index, while this is also the way to avoid major Chinese banks exposed to loss-making enterprises and their bad debts. However, Chinese small caps would probably be hit hard in the event of a financial crisis, and there is also a monetary risk with the Yuan to be taken into account.
Latest developments
After an increase of 32.7% in 2017 (a performance comparable to the Chinese large cap) HAO continued its momentum in 2018 and posted an increase of 6.3%.
The rise in Chinese indices is driven both by the strength of the Chinese economy which continues to grow at more than 6% per annum, as well as by the rise of the Yuan against the USD and the Euro but also because of the rise of Chinese tech through the Alibaba, Tencent and other Baidu who continue to grow even if they remain under the control of the government.
The current period becomes more chaotic because of the trade confrontation with the US and the risk of rising customs barriers on more than $ 100 billion of imports, or nearly 20% of bilateral trade. However, for the moment, this is only a threat and the interest of both parties is clearly to find a positive exit, the bargaining logic should prevail in the coming weeks with probable concessions from both sides, and therefore a trade war seems to us quite unlikely.
The Chinese economy's shift towards services and technology is expected to be increasingly reflected in small-cap companies, which should therefore have an increasingly "growth" bias.
Monthly data

The monthly chart shows a clearly upward trend since the beginning of 2017. The bullish excesses of January were corrected with a return to the EMA13, and after a pause of a few weeks, the index seems to be positioned to resume its uptrend. All indicators are positive and the next step is to reach the 2015 highs in the $ 36 zone.
Weekly data
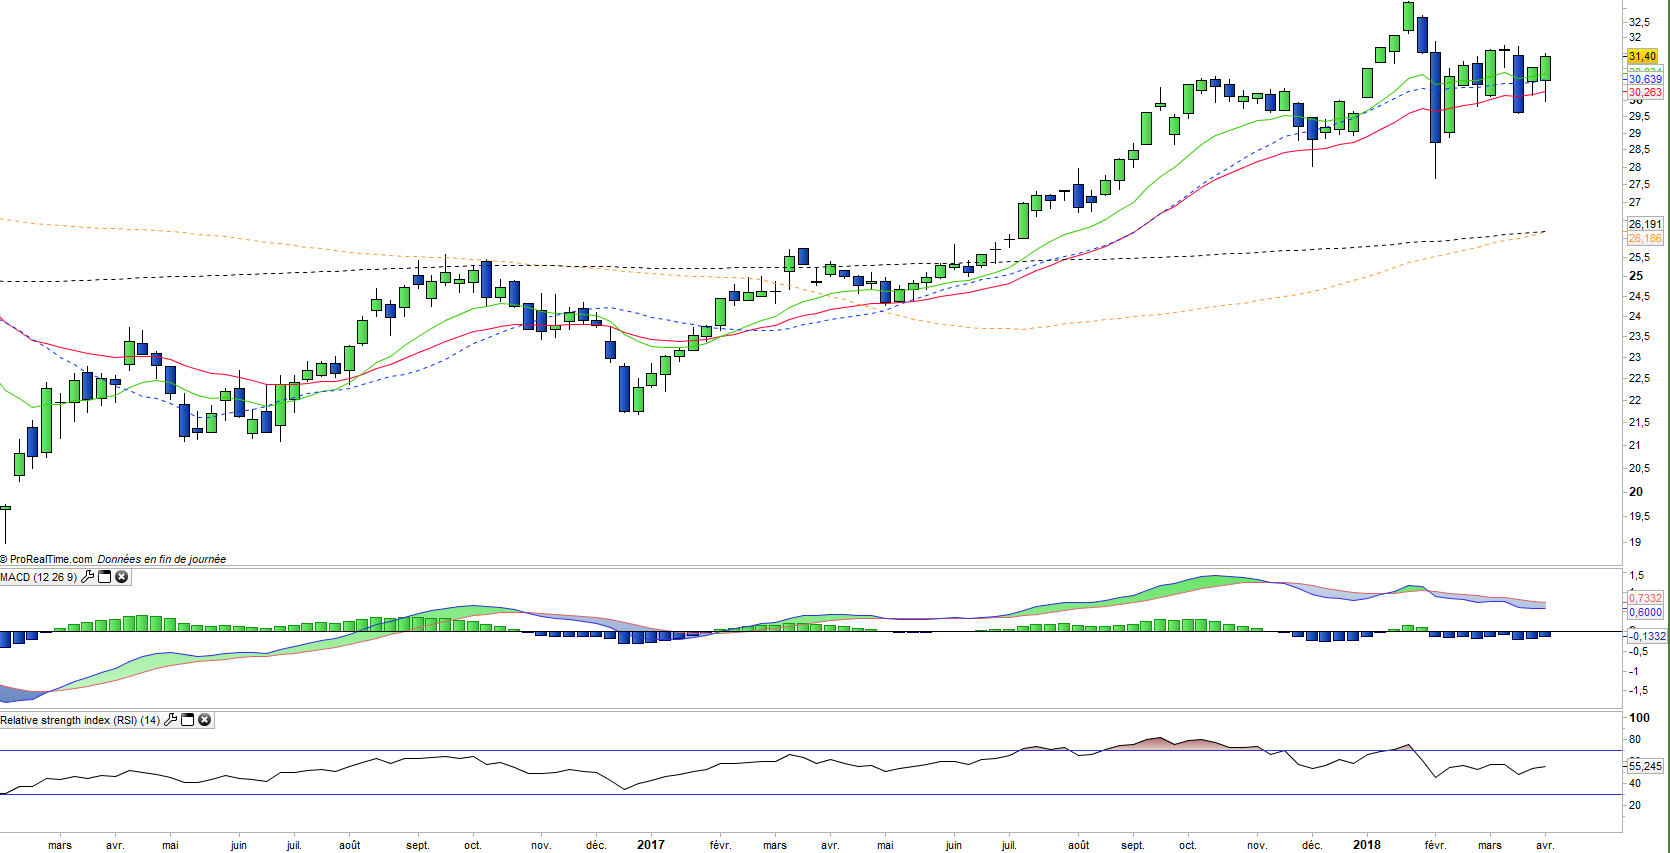
On the weekly chart, there is a clearly bullish mid-term trend that has been rather less disrupted than the major world indices in the first quarter of 2018. The correction seems over and a new surge could occur, after exceeding the resistance of $ 32. The technical oscillators seem ready to turn around, but confirmation is needed.
ETF Objective
HAO is an ETF listed in USD which seeks to replicate the AlphaShares China Small Cap Index (329 companies)
Chacracteristics
| Inception date | 30/01/2008 |
| Expense ratio | 0.90% |
| Issuer | Guggenheim |
| Benchmark | AlphaShares China Small Cap Index |
| Code/Ticker | HAO |
| ISIN | US18383Q8539 |
| UCITS | No |
| Currency | Dollar |
| Exchange | NYSE Arca |
| Assets Under Management | 91 M$ |
| Currency risk | No |
| Number of Holdings | 329 |
| Risk | 4/5 |
Country Breakdown
| Hong Kong | 80% |
| China | 14% |
| USA | 6% |
Sector Breakdown
| Industrials | 17% |
| Real Estate | 16% |
| Information Technology | 15% |
| Consumer discretionary | 14% |
| Basic Resources | 10% |
| Heath Care | 9% |
| Financials | 6% |
| Others | 13% |
Top Ten Holdings
| ZALL GROUP LTD | 2% |
| ZIJIN MINING GROUP CO LTD | 1% |
| ZTE CORP-H | 1% |
| MOMO INC-SPON ADR | 1% |
| WUXI BIOLOGICS CAYMAN INC | 1% |
| YANZHOU COAL MINING CO LTD | 1% |
| SHENZHEN INTL HOLDINGS | 1% |
| LUYE PHARMA GROUP LTD | 1% |
| 51JOB INC-ADR | 1% |
| GENSCRIPT BIOTECH CORP | 1% |
[/groups_member]