Lyxor ETF Turkey - TUR - 16/05/2018
Short Term strategy: Negative (0%) / Trend -
Long Term strategy: Negative (0%) / Trend -
Characteristics of the ETF
The ETF TUR (Lyxor) created in 08/2006 replicates the Dow Jones Titan index of the 20 main Turkish securities with the largest capitalization and liquidity. The calculation method of the index limits the weighting of each security to 15%. ETF fees are quite high compared to the average of our sample and reach 0.65% while AUM amount to 90M €. The replication method is indirect (via a swap) and the distribution policy is capitalized.
Alternative ETFs: TUR (iShares in USD)
Latest developments
The ETF TUR grew by 19.95% in 2017 despite the multiple tensions with its partners in NATO and the Middle East. In 2018, the index fell dramatically by nearly 24%, largely due to the decline in the Turkish lira. Indeed, President Erdogan has just announced his intention to regain control of Turkish monetary policy after the June elections, which means the end of the independence of the Turkish Central Bank. The reaction of the markets is brutal and the Turkish lira has today touched an historic low against the US dollar. This negative spiral could become dangerous if it is not mastered, and should force the central bank to quickly raise its interest rate. The decline in the pound will increase the price of imports, primarily oil which may cause an increase in inflation potentially devastating for the Turkish economy.
Index & components
TUR replicates a narrow index that is very dependent on the financial sector which accounts for 37% of the capitalization, while the industry is the second sector with nearly 22%. The index is highly correlated with the health of the Turkish economy, while energy represents only 7% of the index. This tracker embeds the risk related to the Turkish lira, which can be quite erratic. After double-digit growth for several years, the Turkish economy with a GDP of $ 720bn (17th in the world) suffered a slowdown at the beginning of the decade because of the unfavorable international environment: low growth in the area euro, the readjustment of US monetary policy, the Russian recession and the conflicts in Iraq and Syria. In addition, inside the country, there were political and security tensions that led to an authoritarian drift of President Erdogan which resulted in a considerable purge in the public and private spheres and could have long-term consequences. term. The growth of the Turkish economy grew by 2.9% in 2016, a higher than expected figure, in a difficult political and security context, but significantly behind the 6.1% recorded in 2015. The levels of public debt and the deficit are low, but inflation remains above the 5% target set by the Central Bank. 2017 marks the return to sustained growth close to + 5% compared to 2016 due to the recovery in consumption. Turkey, dependent on imports of intermediate goods for its production, has a trade deficit, despite a steady rise in exports, which have a relatively low value added. The country's economy remains linked to the recovery of the euro zone, a destination for one third of Turkish exports, and the political instability of the Middle East countries. The spearheads of Turkish foreign trade are the automotive and textile industries. Then come, in order, the agri-food sectors, machinery, electronic equipment, iron and steel and chemicals. The European Union is by far the largest customer of Turkey, followed by the United States, China and Iraq. Historically (since 10 years), this tracker has been out of place in an area between € 15 and € 60 and an axis of symmetry around the € 32 level. Volatility is historically not significant, which does not prejudge the future.
Monthly data

The monthly chart shows that prices have returned to major support again, at the risk of breaking it down for the first time since the financial crisis. The rebounds are becoming less powerful and show a long-term trend that is weakening with decreasing highs. All oscillators have turned down and the only hope of rebound lies only in this support at 33 €
Weekly data
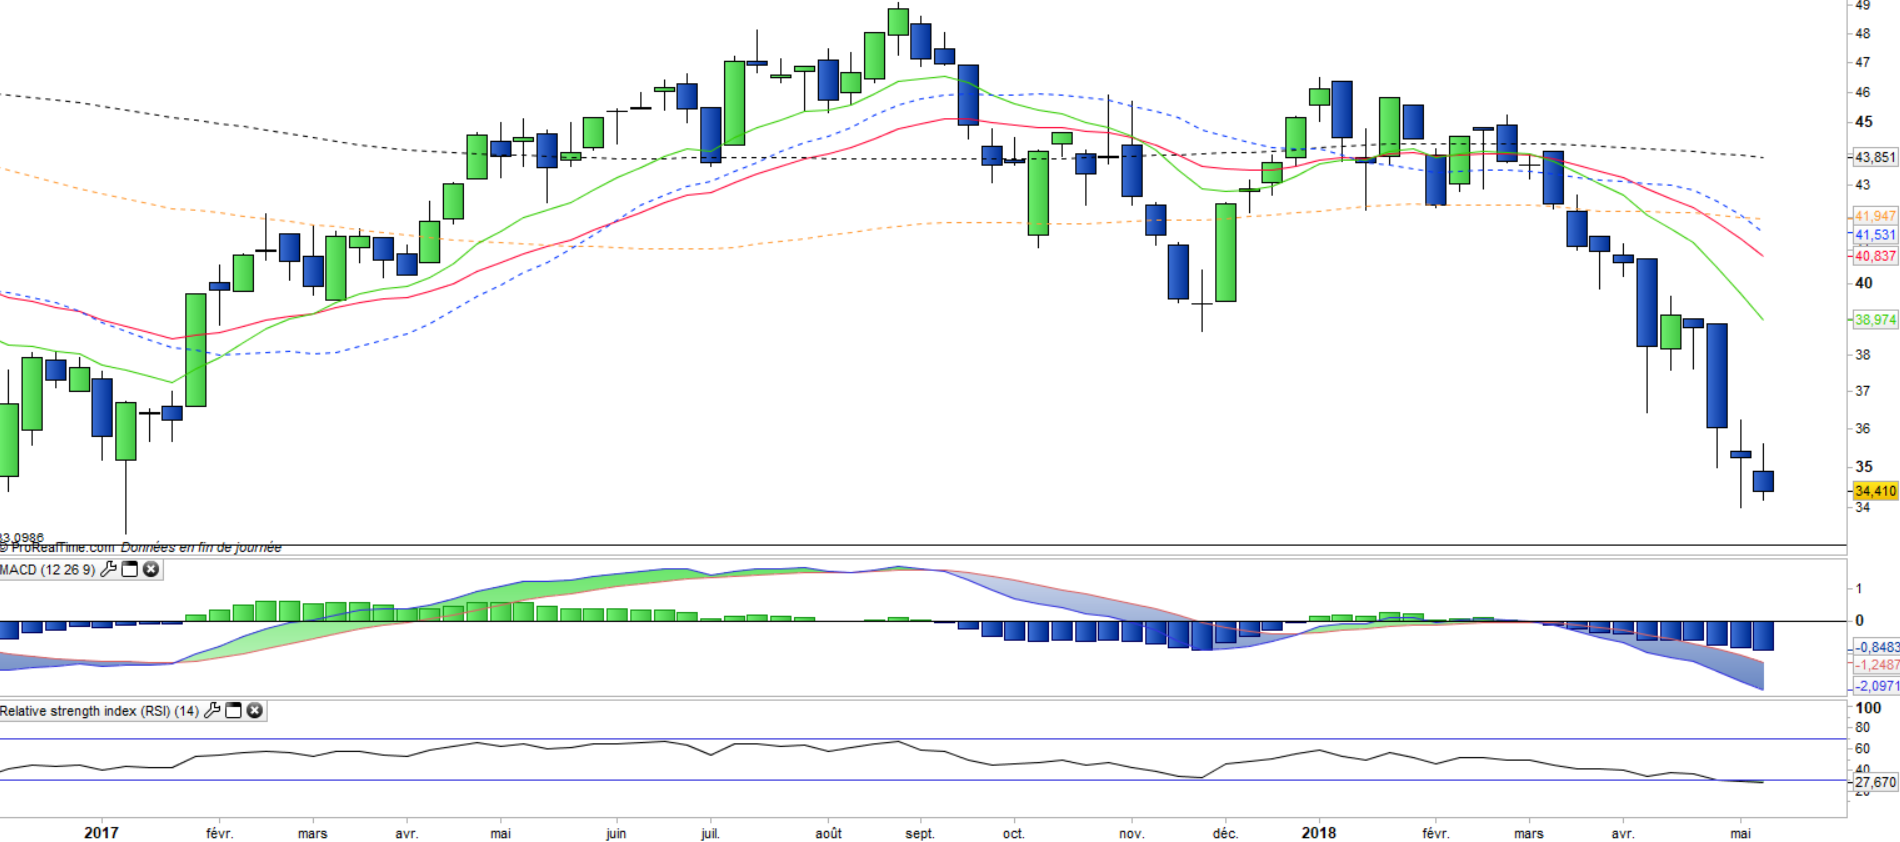
On the weekly chart, we can observe an acceleration in the decline in recent weeks, after the bearish crossing of all moving averages to the area of 43 €. The oscillators are oversold as the support approaches, arguing for a first rebound before a more dangerous bearish breakout attempt. The break in support of € 33 would open a very significant bearish potential.
ETF Objective
TUR is a UCITS ETF listed in €, which seeks to replicate the DJ Titan 20 index (Turkey : 20 companies)
Characteristics
| Inception date | 11/08/2006 |
| Expense ratio | 0,65% |
| Issuer | Lyxor |
| Benchmark | DJ Turkey Titans 20 |
| Ticker | TUR |
| ISIN | FR0010326256 |
| UCITS | Yes |
| EU-SD Status | Out of scope |
| Currency | € |
| Exchange | Euronext Paris |
| Assets Under Management | 90 M€ |
| Dividend | Capitalization |
| PEA (France) | No |
| SRD (France) | Yes |
| Number of Holdings | 20 |
| Risk | 4/5 |
Country Breakdown
| Turkey | 100% |
Sector Breakdown
| Financials | 38% |
| Industrials | 22% |
| Materials | 14% |
| Consumer Staples | 8% |
| Energy | 7% |
| Telecom services | 7% |
| Consumer discretionary | 3% |
| Others | 3% |
Top Ten Holdings
| Eregli Demir Ve Celik Fabrik | 10% |
| Akbank TAS | 9% |
| Turkiye Garanti Bankasi | 9% |
| Bim Birlesik Magazalar AS | 8% |
| Koc Holding AS | 8% |
| Haci Omer Sabanci Holding | 7% |
| Tupras Turkiye Petrol Rafine | 7% |
| Turkcell iletism Hizmet AS | 7% |
| Turkiye IS Bankasi-C | 6% |
| Turk Hava Yollari | 6% |