The Lyxor LEM ETF (UCITS), created in 04/2007 in Euro on Euronext replicates the MSCI Emerging Markets Net Total Return Index. The values of the MSCI Emerging Markets Net Total Return Index are selected to represent 85% of the market capitalization of the Emerging Markets zone, while reflecting the economic diversity of this market. It is a global index of 1123 stocks, with 27% of the capitalization coming from China.
The fee of this ETF is 0.55% and the AUM is approximately € 1423M. The replication method is indirect (via a swap) and there is a dividend capitalization method.
Alternative ETFS: EEM (iShares in USD), EMEA (Amundi in EUR)
Latest developments
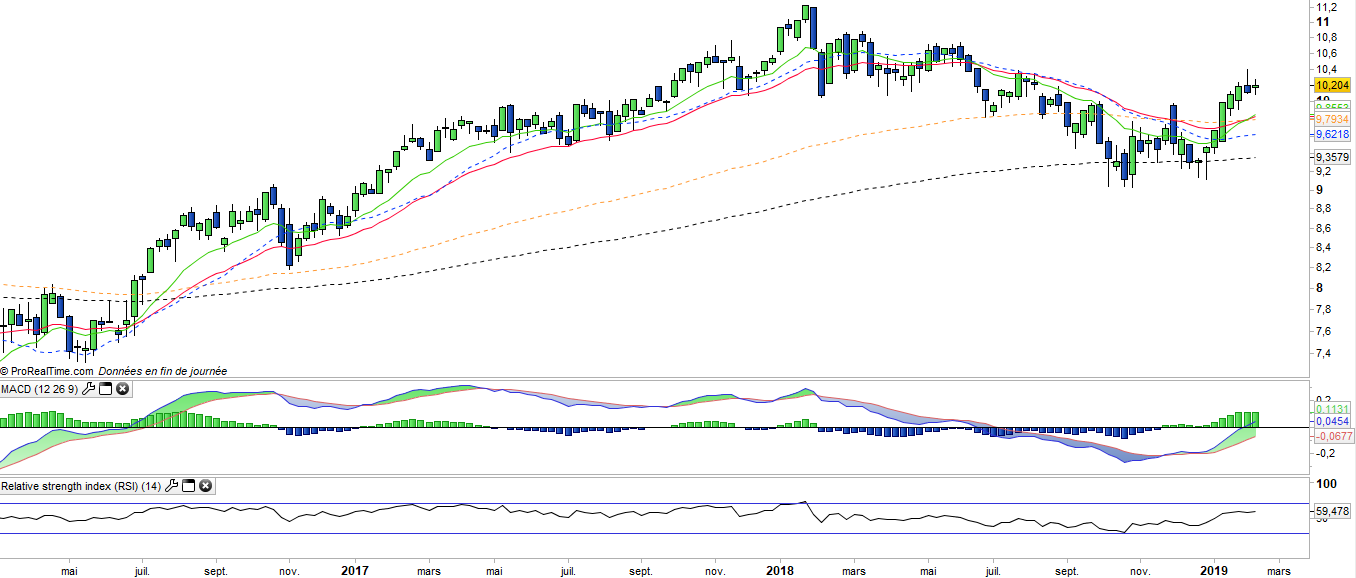
In 2017, the index posted a performance of 20.9% but declined by 10.5% in 2018.
Since the beginning of the year the Emerging Markets Index has rebounded and is up 8.3%. Hopes of trade agreement fuel the rise in the index, with China and Asia taking over from Latin America, which has recovered significantly since the fall, because of the Brazilian elections and hopes of improvement of the economy that accompany it. The progress of negotiations between China and the US this week represents an additional positive signal.
The Emerging Markets Index is closely linked to the Asia zone, which implies a strong dependence on China directly and indirectly. The trade war is therefore a very important issue for this zone and for the index and beyond the dynamism of the Chinese economy.
Index & components
The ETF LEM replicates a broad index composed of 1123 stocks from 28 countries.
The most represented zone is Asia with 70% of the capitalization of the index of which 27% for China, 14% for South Korea and 9% for India. The major South American, African and Middle Eastern economies are represented in the index by market capitalization. The two main sectors are technology (14% of the index) and financials (24%).
The top 10 stocks in the index represent only 21% of the index's capitalization (Tencent is the first capitalization with 4,8%) and the specific risk is therefore quite low.
Emerging countries may be correlated in their stock market evolution, however there are also opposite rationales. For example, a good number of African countries, the Middle East or South America are linked to oil prices while India has an inverse correlation because it exports almost all of its energy.
Global growth is now led by emerging countries, which account for nearly 40% of global GDP, with India (7% growth) and China (6%) leading the way. These two emerging giants are respectively 5th and 2nd world economies in 2018. Next to these two major economies, which together account for 40% of the world's population, a number of major emerging economies such as Brazil, Turkey or Mexico have more chaotic paths because of political problems (Turkey, Brazil) or specific problems, like Mexico in negotiation with the US on trade agreements (looks well in process).
Emerging countries are much stronger financially and economically than they were 20 years ago during the 1998 crisis, and often have lower debt and smaller fiscal imbalances than developed countries due to less generous social systems and more dynamic demography.