iShares Russel 2000 ETF - IWM - 25/02/19
Short Term strategy: Positive (70%) / Trend +
Long Term strategy: Positive (60%) / Trend +
pour accéder à nos achats / ventes sur les indices
Characteristics of the ETF
The IWM (iShares) ETF replicates the RUSSELL 2000 Index, which is a subset of the Russell 3000 Index of the 3,000 largest US companies representing approximately 98% of the US market capitalization. The Russell 2000 Index represents only about 10% of the market capitalization of the Russell 3000 and consists of approximately 2,000 small cap companies ($ 2.2bn market cap on average). The Russell 2000 Index seeks to be truly representative of the mid-cap segment, and is fully reconstituted each year to ensure that larger caps do not distort performance and that corporate characteristics actually correspond to the mid-cap segment.
The ETF IWM is currently the benchmark tracker for replicating this US small cap index with fees limited to 0.19% and AUM of $ 43822M. Replication is direct (physical) and there is a dividend distribution policy on a quarterly basis.
Alternative ETFS: VTWO (Vanguard in USD), RUS2 (Lyxor in USD)
Index & components
The Russell 2000 Index is a very broad index that can be used to profoundly address the US mid caps universe.
The interest of this index is in addition to the high number of components, characterized by the great diversity of the sectors addressed: the financials (c.18%), the technological compartment (c.15%), the industry (c.15). %), health (c.15%) and consumer goods (c.12%) are the main sectors, in a very balanced index which in the end looks very representative of the US economy. However, we can notice that growth themes are more represented, compared to sectors considered as mature, such as energy (3.6%), utilities (3.5%) or telecommunications (3.2%), which are historically heavily represented in the big indices like the Dow Jones for example.
The Russell 2000 valuation multiples are not really higher than those of the large-value indices, with currently a 17,5x earnings PER at 12 months forward versus 17.5x for the S & P 500 and 20x for the Nasdaq. In addition, the companies that make up the Russell 2000 are often companies that are already well structured internationally and therefore in a position to take full advantage of the recovery of the global cycle. These companies, by their average size, are more sensitive to the economic cycle and should therefore record higher growth rates than large companies in the coming months, especially since the margins of large US companies are already at an historical high level.
The small valuation differential with respect to the major indices may therefore appear as an opportunity in that the growth gap could be quite large. The new round of rate hikes will, is on “pause mode” according to the latest Fed statements, should not pose a threat to US growth in the coming months while the USD is stabilizing against the Euro and other currencies.
Latest developments
The Russell 2000 has risen 18% since the beginning of the year (against + 11.4% for the S & P500), after a drop of -12.2% in 2017 (versus -6.2% for the S & P500). After having been the weak link in the US market in the latter part of 2018, the Russell 2000 index is once again a driving force, which shows a new « risk on » mood on the market.
The Russell2000 / S & P500 spread is positive again in the short term, while investors are paying close attention to these divergences, as the Russell2000's downward or softening trend is often seen as a leading indicator of the fall in the major indices. The Russell 2000 is considered as an "amplifier of the trend". The divergences can hardly be explained by sectoral biases, and more naturally by the interest in growth stocks according to the policy of the FED on rates hike and the vigor of the US economy.
The positive inflection on the index is clearly attributable to the Fed, which put its rate hike policy in a « pause mode » and then reassuring corporate results.
Monthly data
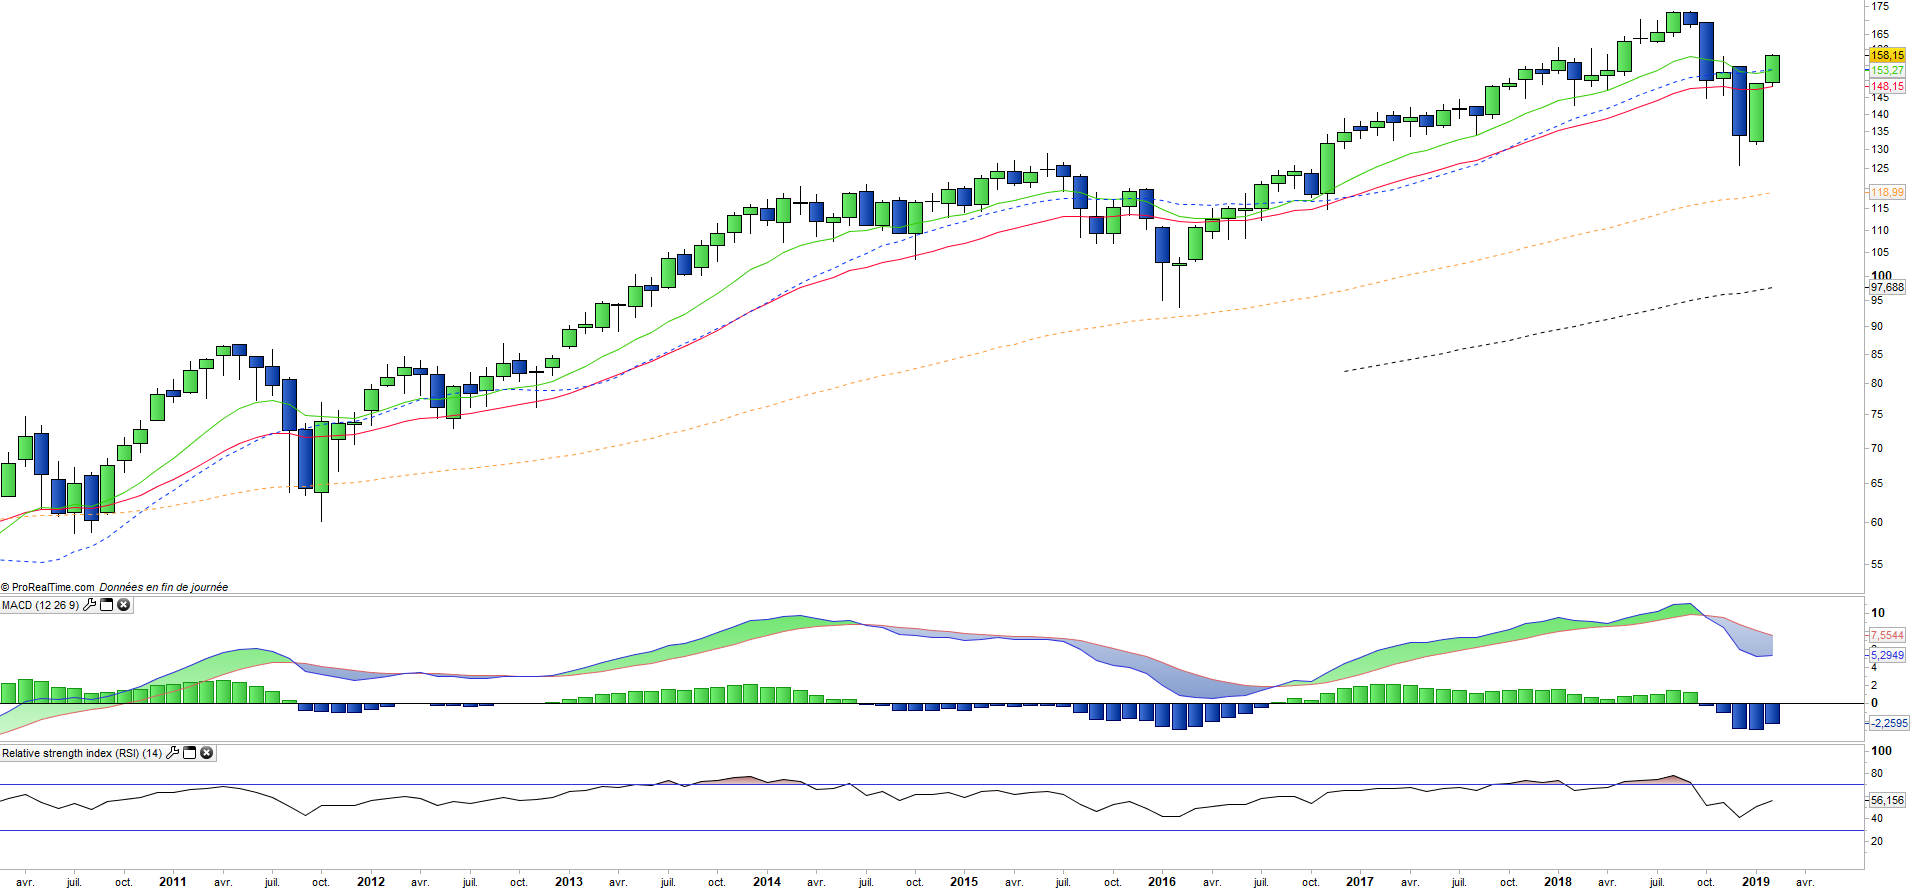
On the monthly chart we see the sharp fall of the index in October and November and a very strong rebound in January and February that erases almost all of the correction. The index recovered above the EMAs13 and 26 and the technical oscillators are recovering as for the RSI and the momentum indicator. Monthly confirmation is required to validate recovery of the positive long-term trend.
Weekly data
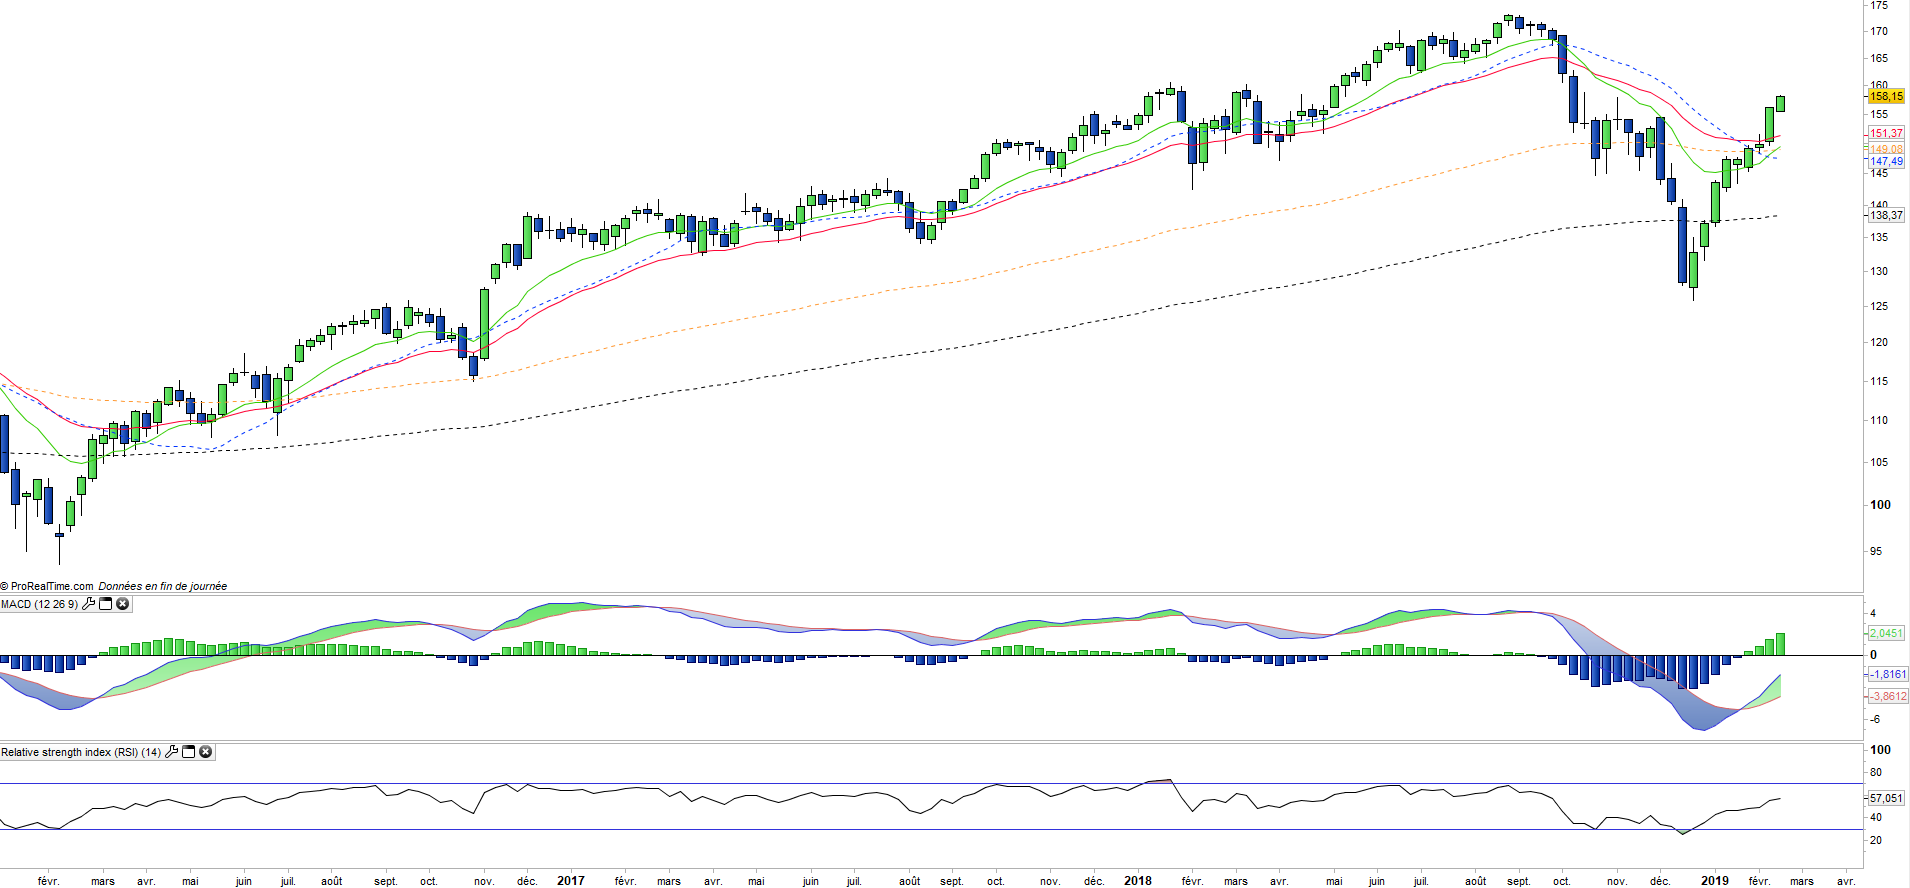
The weekly chart shows a "V" recovery with an index that returns very quickly to the summer 2018 levels. At the technical level, the recovery will be really effective when the EMAs13 and 26 are crossed up and the MACD will have passed his zero line. These two steps should occur fairly quickly if the index manages to preserve current levels.
Theme
IWM is an ETF, listed in USD, which seeks to replicate the Russel 2000 index (2015 US companies)
Characteristics
| Inception date | 22/05/2000 |
| Expense ratio | 0,19% |
| Benchmark | Russel 2000 |
| Ticker | IWM |
| ISIN | US4642876555 |
| Currency | $ |
| UCITS | No |
| Exchange | NYSE |
| Assets Under Management | 43 822 M$ |
| Replication Method | Direct (Physical) |
| Dividend | Distribution |
| Currency Risk | No |
| Number of Holdings | 2 015 |
| Risk | 3/5 |
Country Breakdown
| USA | 100% |
Sector Breakdown
| Financials | 18% |
| Health Care | 15% |
| Industrials | 15% |
| Information Technology | 15% |
| Consumer Discretionary | 12% |
| Real Estate | 7% |
| Materials | 4% |
| Others | 10% |
Top Ten Holdings
| Five Below Inc | 0.3% |
| Etsy Inc | 0.3% |
| Trade Desk Inc | 0.3% |
| Integrated Device Technology | 0.3% |
| Hubspot Inc | 0.3% |
| Ciena Corp | 0.3% |
| Cree Inc | 0.3% |
| Woodward Inc | 0.3% |
| Coupa Software Inc | 0.3% |
| Entegris Inc | 0.3% |