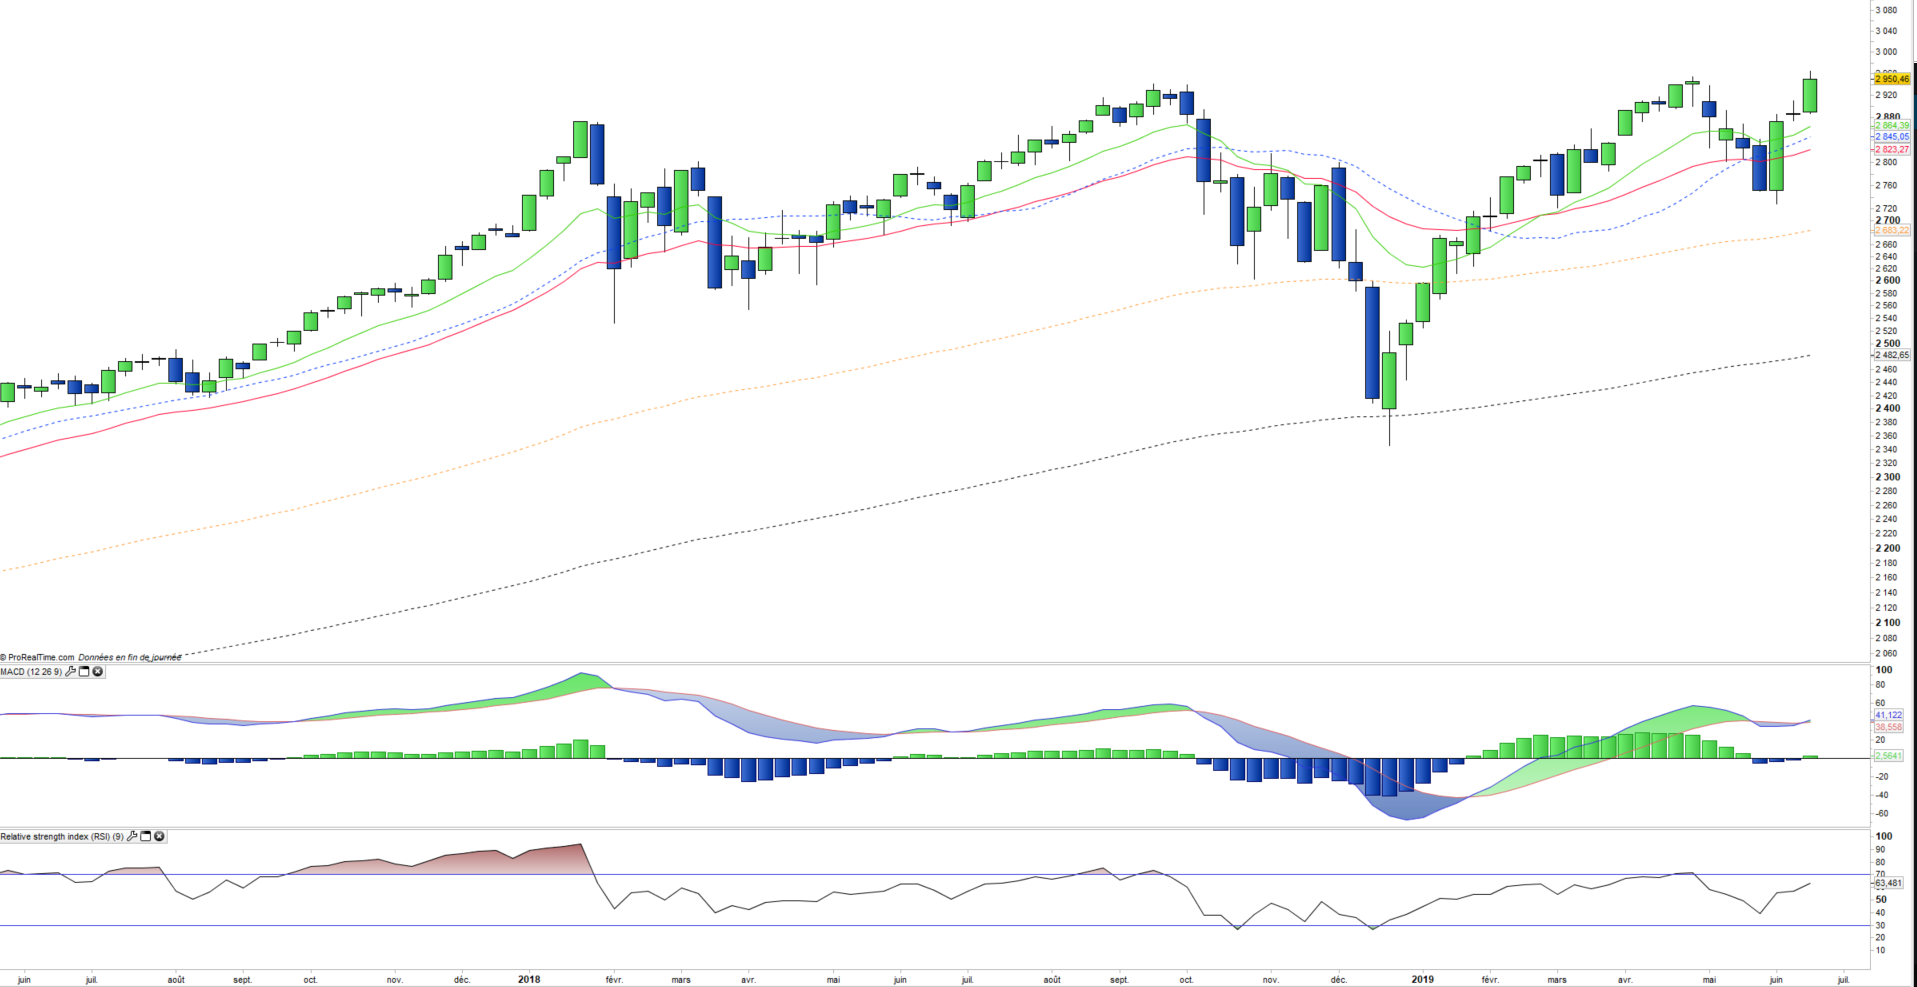
US S&P500 : Breaking the roof?

US S&P500 - 24/06/19

Short term trend: Positive (100/100)
Long term trend: Positive (95/100)

Scores calculés par nos algorithmes propriétaires - cf méthodologie

index profile

The top 10 stocks of the S & P500 include five major technology stocks (Apple, Amazon, Microsoft, Alphabet and Facebook), but also larger, more classic and iconic American companies such as JP Morgan or Exxon Mobil. The main benefit of this index is its depth, which allows it to be a good proxy for the US economy, with a sector weighting that favors the growth sectors a little more, just like the technology stocks that represent about 20% of the weighting. Financial stocks account for just over 13% of the index and energy stocks around 5% are well balanced by defensive sectors such as health (around 15%) and consumer discretionary (10%).

After a 19.4% rise in 2017, the S & P500 posted a 6.2% drop in 2018 due to expectations of an economic downturn related to the worsening trade war between the US and China and a at the same time, interest rate increases by the FED. The index rebounded 17.7% in 2019 due to a change of course of the Fed that no longer plans to raise rates in the short term but rather to lower them, and business results that were rather reassuring in the first quarter with reasonable growth prospects in 2019 related mainly to share buy-backs.

However, the reactivation of the trade war with China puts the risks on the global economy at high risk, not to mention a risk of conflict in the Middle East while the Fed could be more accommodating. The S&P500 is well valued at 17x earnings, leaving little room for growth for expected earnings growth of + 5% this year.

Instruments : SPY (SPDR in USD), SP5(Lyxor in Euro), IVV (iShares, in USD)

Weekly data

The weekly chart shows a new attack of the 3000pts ceiling by the index after the failure of the fall bearish start. Moving averages are bullish again and the MACD has returned to rising. The index is bullish again on the medium-term horizon but is on a zone of major resistance. A depression of this resistance would release a new upside potential for the index, if it fails to do so it would confirm the period of trading range.
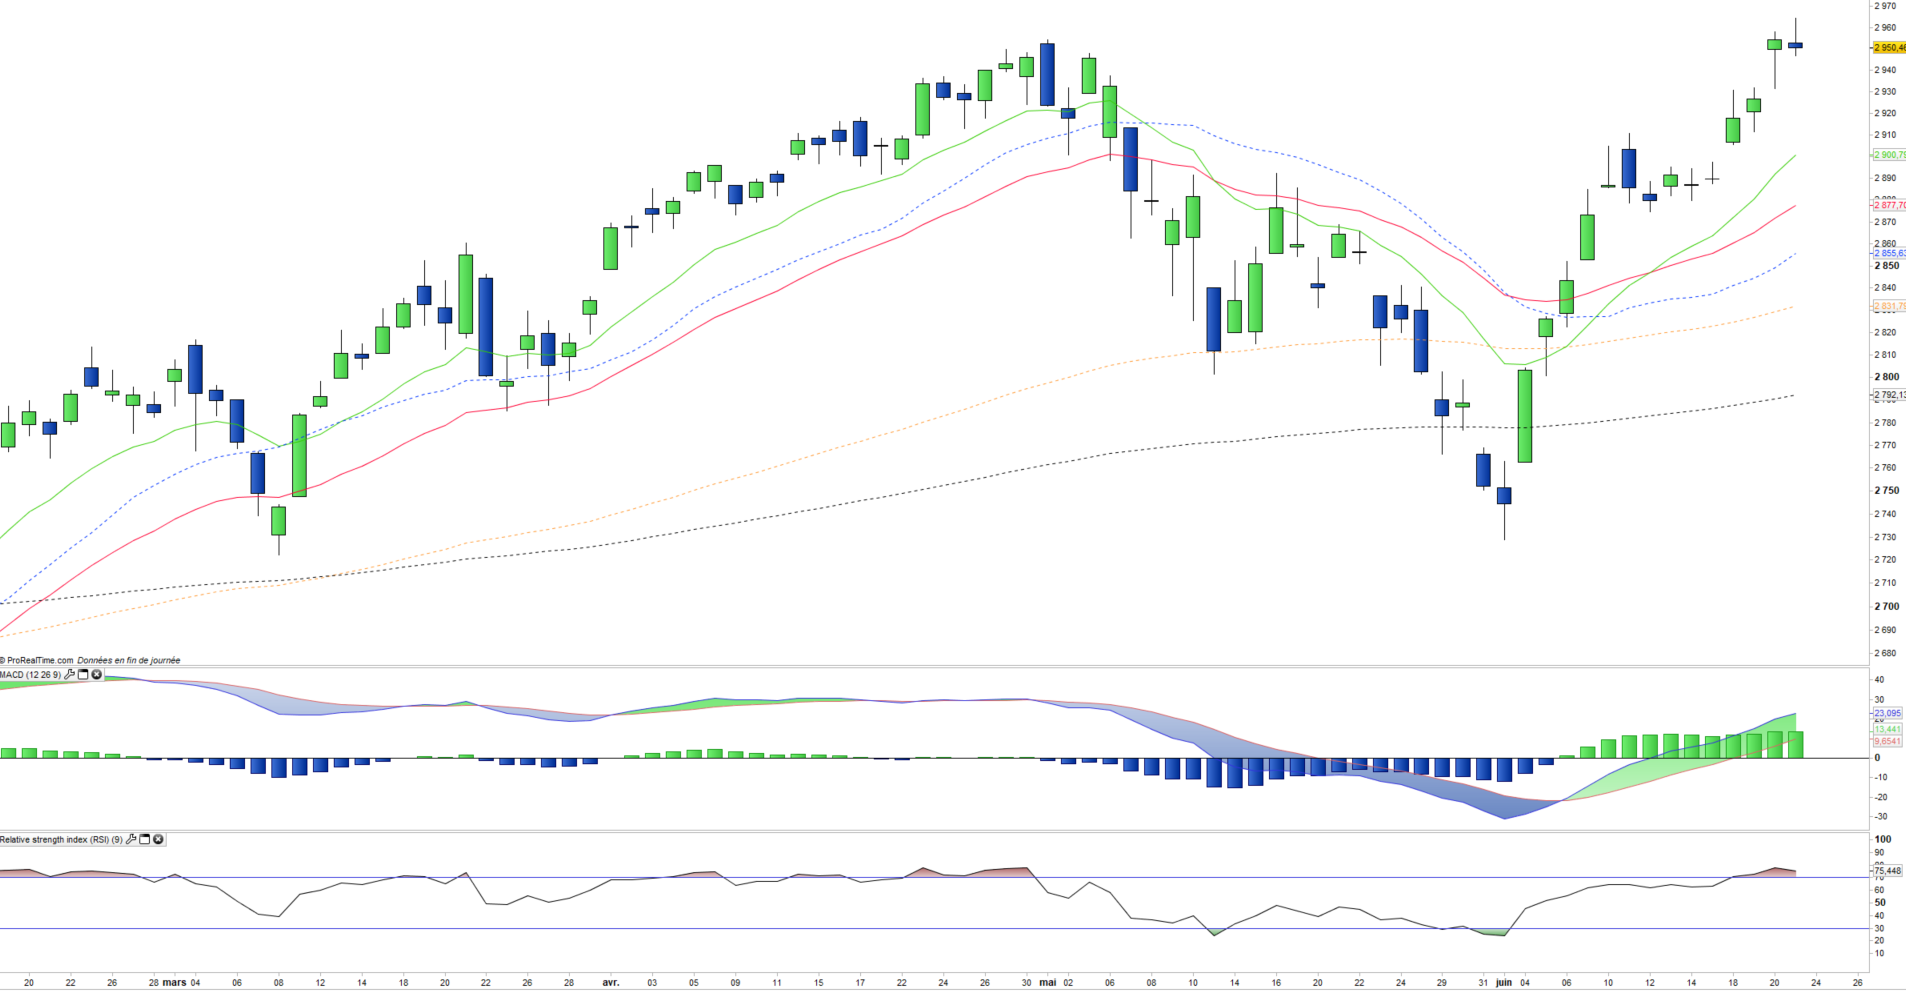
Daily data

On the daily chart, we can see the new highs achieved by the index as well as the slightly overbought nature of technical indicators that makes short term  profit taking likely near the resistance of 3000 pts. The behavior of the index starting from this level will make it possible to judge the real appetite of the market for risk, after a flow of positive news that are now integrated in prices.

Country Breakdown

USA 100%

Sector breakdown

Information technology 22%
Health care 14%
Financials 13%
Consumer discretionary 10%
Communication services 10%
Industrials 9%
Consumer staples 7%
Others 14%

Top Ten holdings

Microsoft  4%
Apple 4%
Alphabet 3%
Amazon 3%
Johnson & Johnson 2%
Facebook 2%
Berkshire Hathaway 2%
JPMorgan Chase & Co 1%
Exxon Mobil 1%