The tracker IYT (iShares-BlackRock) tracks the US transport indexe consisting of a selection of 20 US-based stocks on transport, logistics and the cargo.
This is a very focused Index from a geographical point of view, mainly composed of US securities and quoted in USD, but more diversified on subsectors of activity since 29% of companies are specialised in the air freight & Logistics, like Fedex, 24% are railway companies, 23% are airlines, 17% of trucking and 6% of shipping. This sector is cyclical and therefore closely correlated to economic growth. The dynamics of margins also depends upon the price of fuel (therefore barrel price), while interest rates are also important for investment in transport fleets.
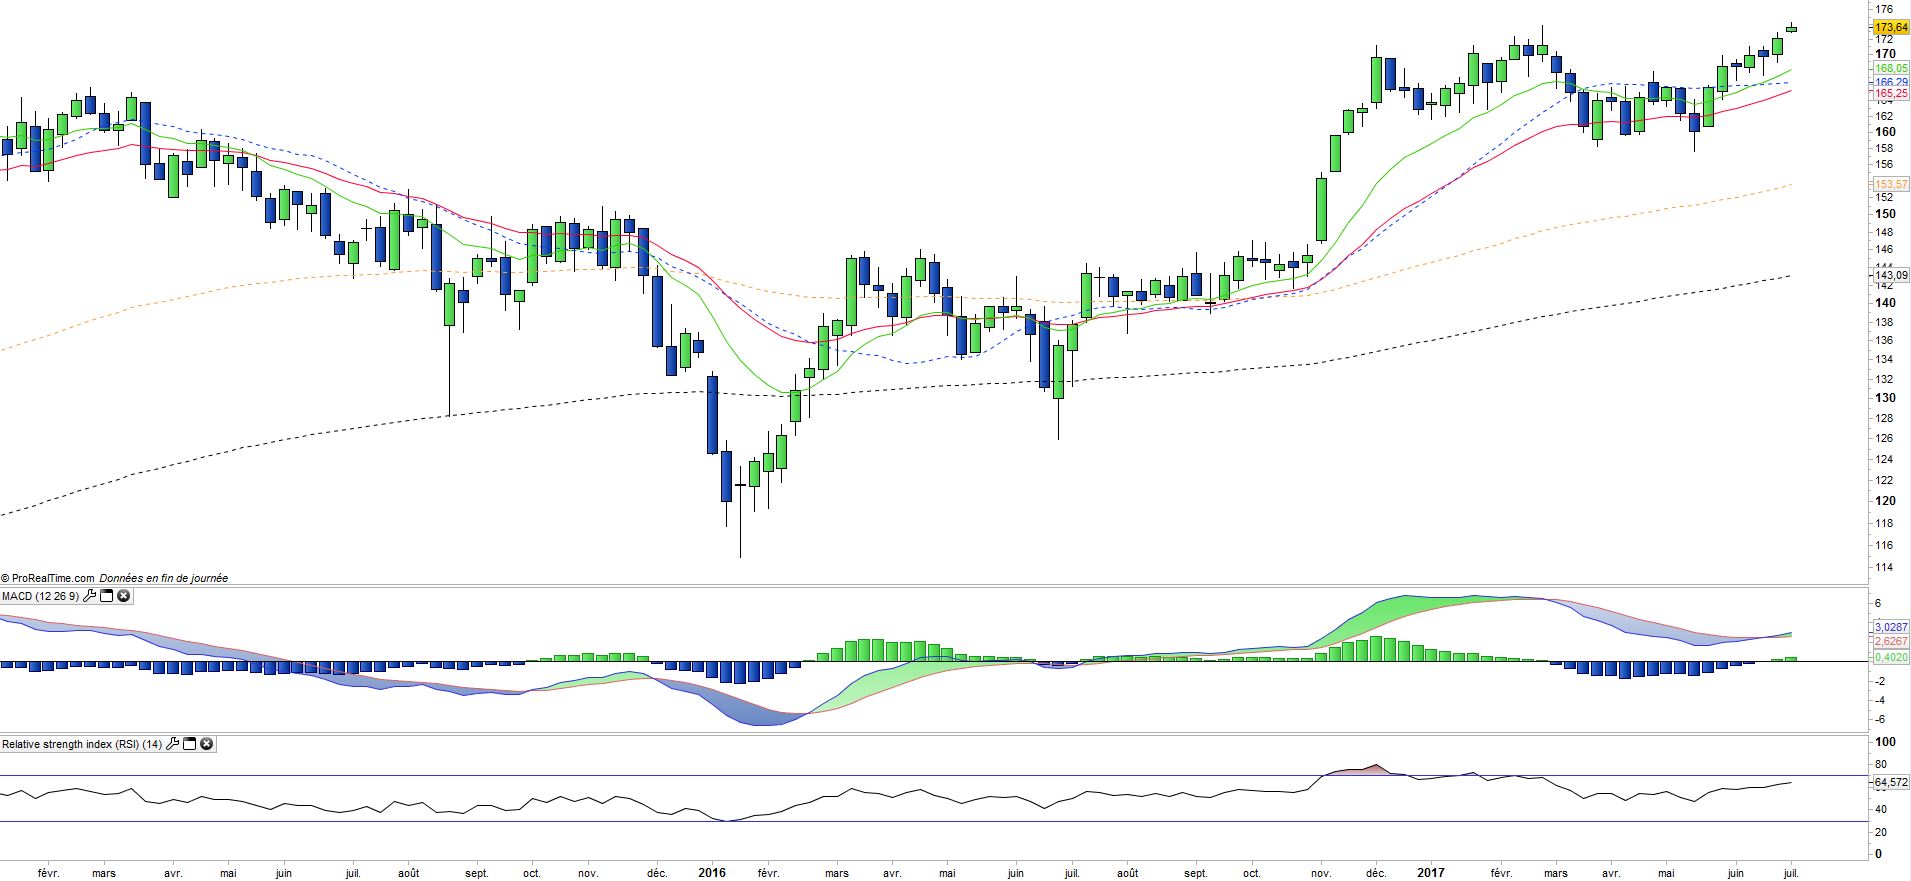
The sector is doing well due to sustained growth in the US, a still low rates environment while oil prices remain moderate. All the signs are positive and the index should continue its upward path. US growth should remain in a 2 to 2.5% range in 2017, while the rate hike should be a gradual, due to short term uncertainties linked to the policy of Donald Trump in respect with inflation and fiscal slippage. A stimulus infrastructure coupled with a massive taxes cut for businesses could extend the economic cycle already exceptionally long- for 2 more years according to some economists. Starting in 2017, the stabilisation of oil prices should allow a gradual restart of the industry which is a major consumer of freight (maritime, road and rail).
The expenses of IYT are relatively normative to 0.44% (Assets Under Management : 946 M$).
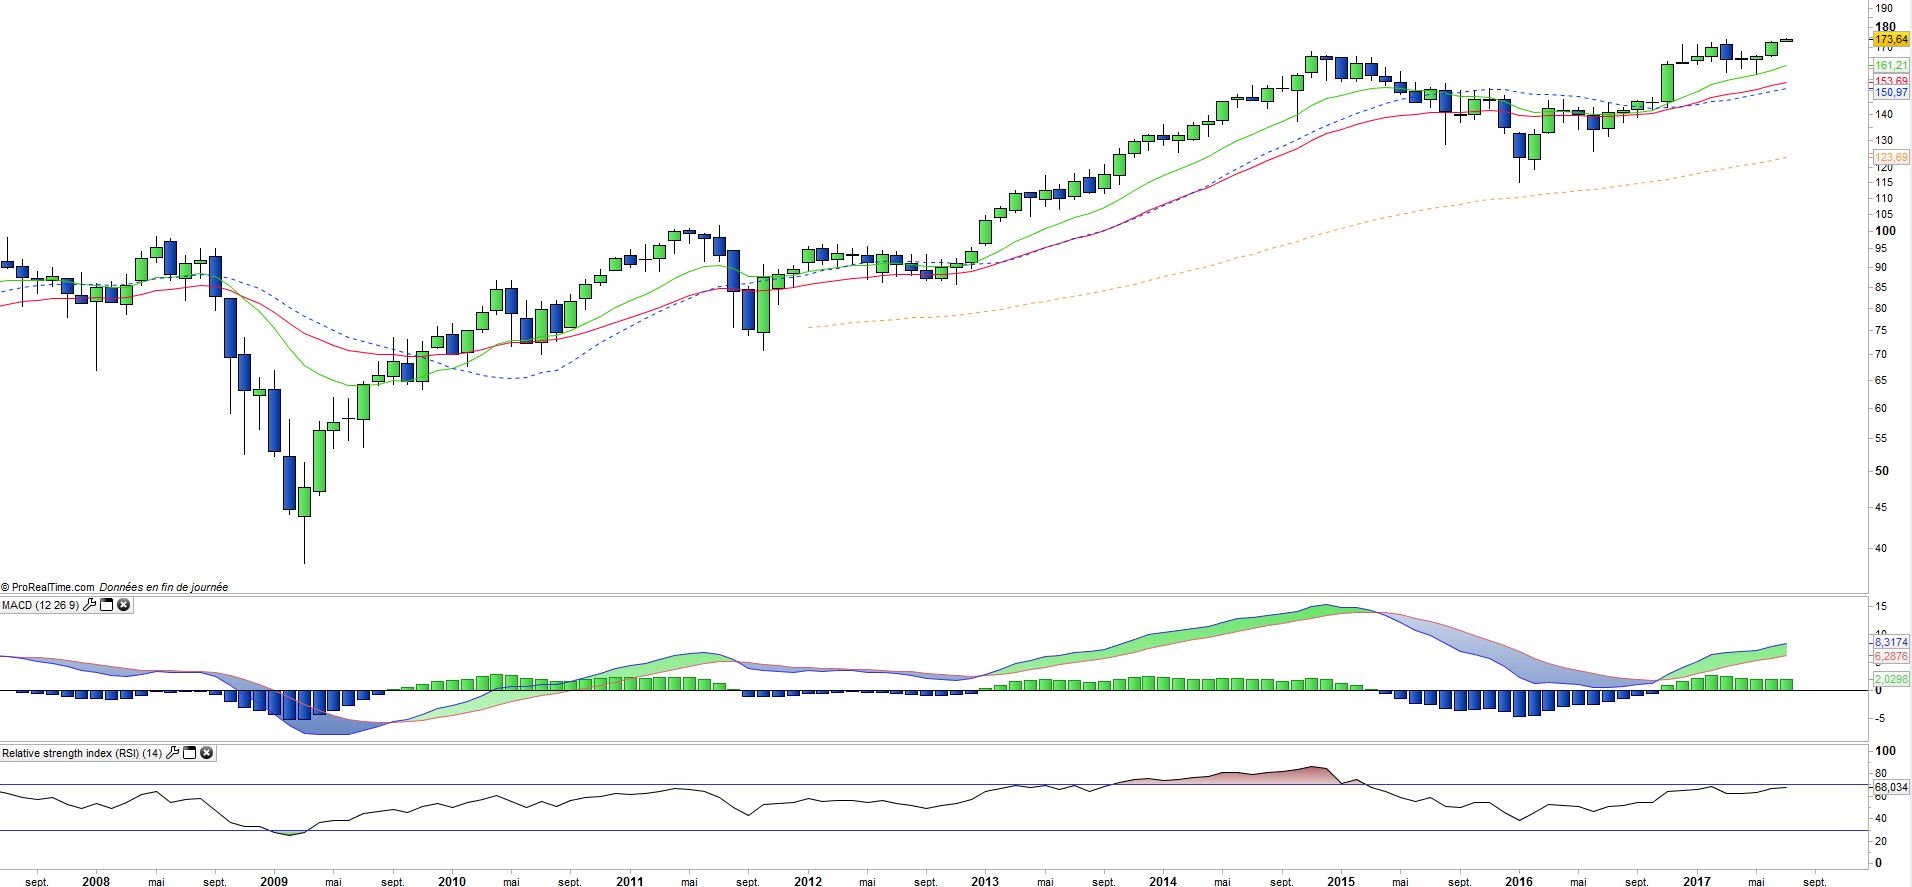
The historical performance of the ETF is satisfactory, +20.9% in 2016 and +6.6% since the beginning of the year and about 10% per year on average since its inception (2003) in USD, while the expenses remains relatively normative to 0.44%. The regularity of US growth has enabled this index to deliver an average high and consistent performance over the last 13 years (280%). The ETF is therefore a bet on continuing US growth, in a context of moderate and stable rates and energy prices, which should persist for structural reasons resulting from technology and globalization.