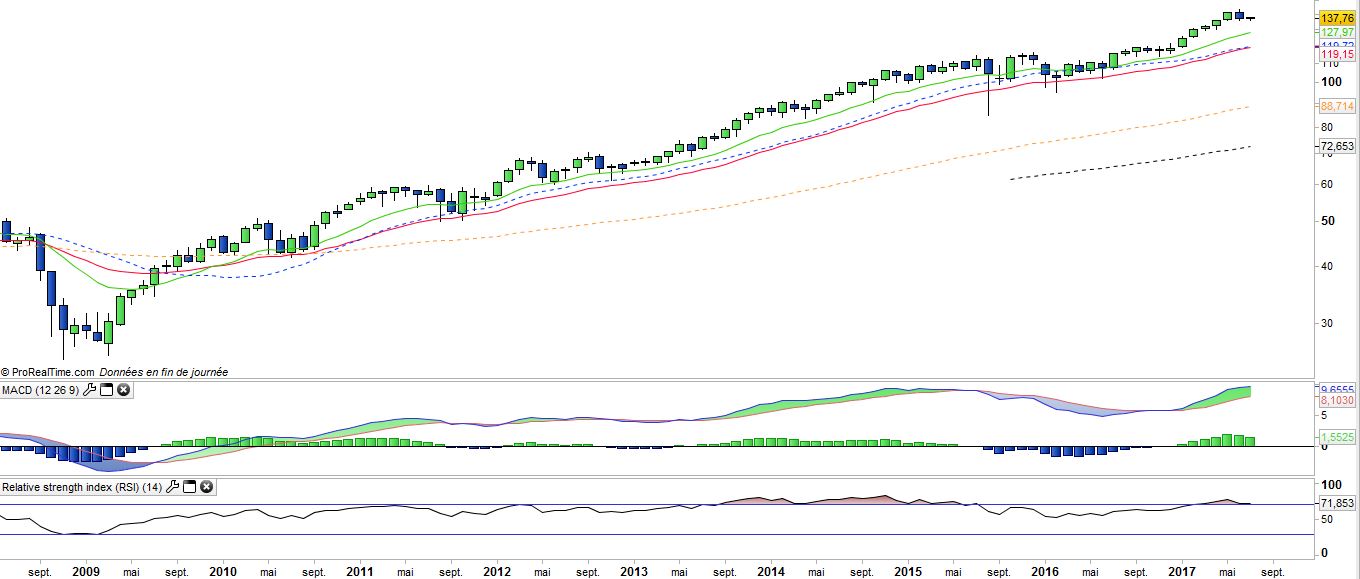
The tracker QQQ (Powershares) tracks the Nasdaq100 Index, which is composed of the 100 largest non-financial US securities, primarily in the technology sector and listed on the Nasdaq, selected according to the importance of their market capitalisation. The top 10 holdings, including Apple, Amazon, Alphabet, Microsoft Facebook, and represents approximately 50 percent of the market capitalisation of the index, while Apple alone weighs more than 10%. The interest of this index is to take a diversified bet but still focused on the best technology stocks, especially GAFAs (Google, Apple, Facebook and Amazon). The Index is particularly impacted by the Apple stock price that have been under pressure well into 2016, in the wake of disappointments on the iPhone 6s and Smartwatch, but the stock has picked up since the summer 2016, with the successful launch of the iPhone 7.
Big technology stocks posted generally very good performance since the beginning of the year 2017, in particular the GAFA but also Semiconductors (Intel) and Microsoft. Large stocks of biotechnology, like Gilead remained under pressure for many months, reflecting uncertainty about US policy in terms of health gouvernment policies, and the reduction in the speculative premiums after the failure of major transatlantic operations. However, the attraction of biotechnology companies US remains on a national level, as these corporations are often targets of choice for major US labs, as well as an alternative to transcontinental operations.The volatility of the Index is rather limited, which reflects the significant weight of market capitalisations often above 100 bn $for the top 10 companies, even 300 bn $ for the first 5.
The costs of the ETF is 0.2%, which is in the lower range of our selection. The liquidity of this ETF is 50 208 M$.
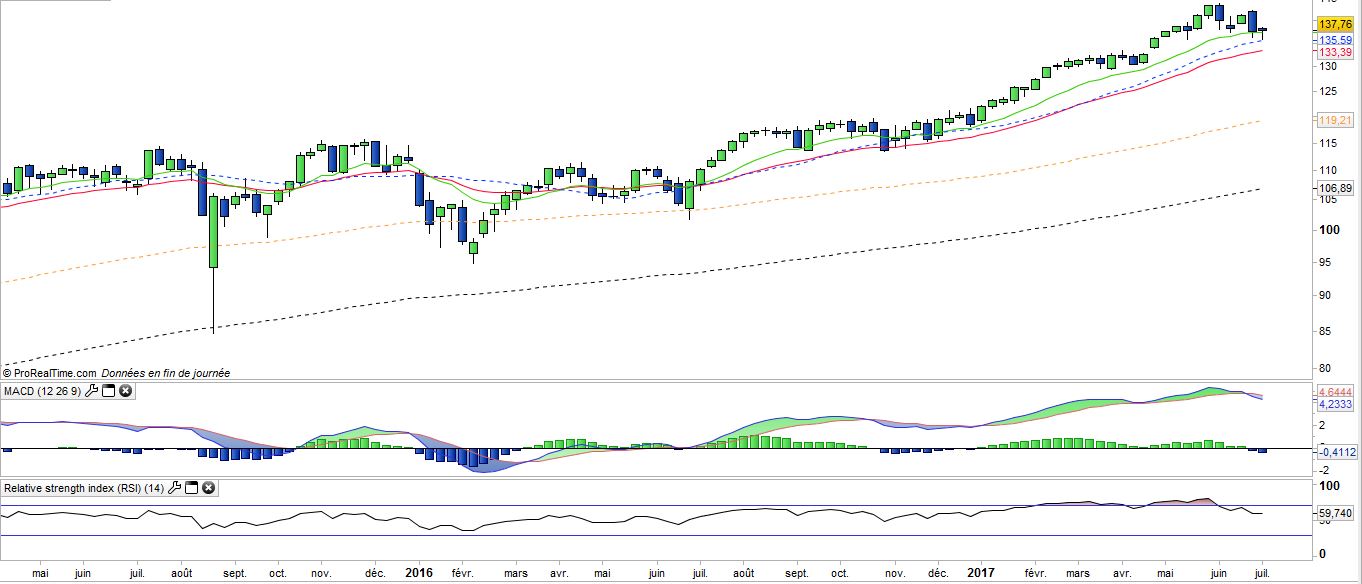
The earnings growth should be above 10% in 2017, but the valuations looks now stretched (> 20x profits) while the stock’s prices of GAFA fly to new highs and are the real engine of the market. The Nasdaq 100 posted a 16% rise since the start of the year, and and the short-term correction started in June (around -5% from the highest) seems insufficient for an immediate recovery. The quality of T217 will be key to avert a deepening of the correction.