

Risk of Crash:
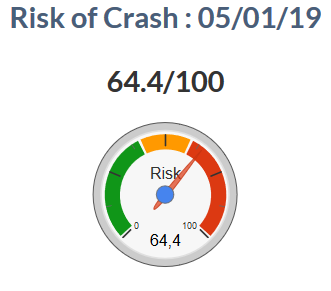
Our Crash indicator dropped to 64.4 from 68.7 / 100 last week after a rebound in world markets.
The VIX is down sharply to 21.4 from 28.3 at the end of last week, despite the Apples’s profit warning.
The rise in global equity markets was broad-based with the US recovering an average of 2% over the week, as well as the Stoxx600 and around 1.5% for emerging markets driven by Brazil.
The Fed's more cautious stance on rising rates and good unemployment statistics caused the markets to rise sharply on Friday. US long-term rates have stabilized at 2.7% and gold hold firm above $ 1280 an ounce.
Oil confirmed its rebound, surpassing $ 48 for WTI in the wake of US equity markets.
Robot Allocator :
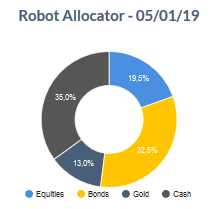
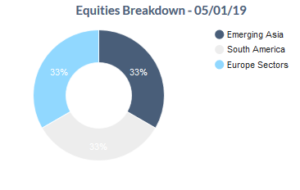
Our Robot Allocator lowers the cash position in the portfolio from 50% to 35% while our Krach indicator drops to 64.4 / 100 versus 68.7 / 100 despite the rise in gold and US government bonds , but in a context where volatility drops sharply with a VIX at 21.4 (against 28.3). The situation is changing in our Global Macro portfolio in terms of asset allocation, as we injected a double gold line (13% of the allocation) with an equity sub-fund representing 19.5% of the portfolio versus 16,7% (unchanged within the sub-fund), compared to 32.5% for bonds verus 33.3% last week (with 5 lines instead of 6) and 35% in cash. The allocation remains defensive even if the share of the shares increases slightly and the share of cash decreases.
The positive variations of the week mainly concern gold, oil, as well as sectors and countries exposed to the prices of these commodities, but also emerging countries, with Latin America and Brazil and some Asian countries (Indonesia , Thailand). Among the declines are raw materials (copper, coffee), India and corporate bonds. Overall the week is characterized by many positive but minor variations.
The Global Macro portfolio (strategy based on the Allocator Robot) achieved a 0.5% performance this week related to the rise in shares. Shares rose by an average of + 3% over the week, led by Latin America (LTM: + 7.9%) and to a lesser extent Utilities Europe (+ 2.6%). Bonds were stable this week despite rising emerging market bonds (AGEB: + 1%) but offset by Corporate debt (CBBB: -0.5%). The relative performance of the portfolio was also due to a 50% cash position.
Short Term scores and Long Term scores by Asset Classes:
| SHORT TERM | LONG TERM | |||||||
| Asset Allocation | W | W-1 | variation | W | W-1 | variation | ||
| Equities Score | 24 | 11 | 13 | 28 | 28 | 1 | ||
| Gold Score | 100 | 70 | 30 | 60 | 30 | 30 | ||
| Oil Score | 10 | 0 | 10 | 0 | 10 | -10 | ||
| Commodities Score | 27 | 21 | 6 | 19 | 23 | -3 | ||
| Bonds Score | 64 | 58 | 6 | 46 | 38 | 8 | ||
| SHORT TERM | LONG TERM | |||||||
| Equities Scores | W | W-1 | variation | W | W-1 | variation | ||
| US Equities | 11 | 0 | 11 | 27 | 27 | -1 | ||
| Europe Equities (sectors) | 18 | 6 | 13 | 29 | 28 | 2 | ||
| South Europe Equities (Countries) | 13 | 0 | 13 | 9 | 13 | -4 | ||
| Asia Equities | 37 | 28 | 8 | 30 | 28 | 3 | ||
| South America Equities | 48 | 20 | 28 | 32 | 32 | 0 | ||
| Middle East - Africa Equities | 36 | 22 | 14 | 32 | 32 | 0 | ||
| SHORT TERM | LONG TERM | |||||||
| Bonds score | W | W-1 | variation | W | W-1 | variation | ||
| High Yield | 10 | 0 | 10 | 15 | 15 | 0 | ||
| SHORT TERM | LONG TERM | |||||||
| Commodities Scores | W | W-1 | variation | W | W-1 | variation | ||
| Metals | 30 | 27 | 3 | 26 | 32 | -6 | ||
| Agricultural commodities | 26 | 16 | 10 | 12 | 12 | 0 | ||
Top 5 Short Term falls:
| Short Term | Variation | ||
| ETF | Ticker | Score | W-1 |
| ETFS Natural Gas | NGAS | 30 | -10 |
| AMUNDI ETF BBB EURO CORPORATE INVESTMENT GRADE UCITS ETF | CBBB | 30 | -10 |
| AMUNDI ETF EURO CORPORATES UCITS ETF | CC4 | 30 | -10 |
| Invesco China Small Caps ETF | HAO | 0 | -10 |
| Teucrium Sugar Fund | CANE | 0 | -10 |
Top 5 Short Term rises:
| Short Term | Variation | ||
| ETF | Ticker | score | W-1 |
| iShares MSCI All Peru Capped ETF | EPU | 50 | 40 |
| Lyxor Thailand (SET50 NET TR) UCITS ETF | THA | 40 | 40 |
| Lyxor Brazil (Ibovespa) UCITS ETF | RIO | 100 | 40 |
| Teucrium Soyb Fund | SOYB | 70 | 60 |
| Lyxor ETF Latam | LTM | 100 | 70 |
Methodology:
Crash indicator
Our indicator is calculated based on quantitative criteria that qualify crash's risk based on the volatility market behavior (VIX), gold, US bonds (10 years) and the MSCI World. We adopt weightings of these different criteria in order to assess the market risk and its evolution on a weekly basis.
Short Term and Long Term Scores
The scores are calculated by our algorithms on the basis of quantitative criteria over several time horizons. These scores are between 0 and 100. Beyond 50 points the momentum is considered positive, under 50 points the momentum is negative, and the 50 points represent a neutral score. Dynamically, all comparisons are based on scores calculated one week earlier

Our Asset Allocation Robot reduces the cash component in our Global Macro portfolio to 35%, taking into account a Krach indicator that has fallen by 4 points to 64.4 now.
Equity Markets remain undeniably bearish, with short-term and long-term scores of 24 and 28 respectively, still very far from becoming positive again (> 50).
All geographical areas remain in short-term and long-term negative. However, we must point out the significant increase in the short term score of Latin America (48/100, +28 in one week).
This sharp rebound in the Latam area has also given rise to a buy signal on the LTM ETF (Lyxor LTM), with scores of 100 at CT and 70 at Long Term now. Brazil, which is widely represented in this ETF, also enjoys positive scores.
In general, today the emerging countries (Asia: Short Term Score 37, Long Term score 30) and the Middle East - Africa region (CT 36, Long Term 32) are the best configured, unlike the US or Europe , whose short term scores have not benefited from the small rebound of last week (respectively 11 and 18).
In the Asia-Oceania region, Indonesia also gave a buy signal, with short-term and long-term scores of 100 and 60.
In Europe, only Utilities have been doing well for several weeks (UTI: Short Term score 90, Long Term 100) and to a lesser extent Telecom (TEL).
In the United States, no sector index came back in positive short term, but the rebound of the week allowed the Technology sector (IYW) to join the Health Equipment (XHE), Internet (FDN) and Softwares & Services (XSW) in Long Term Neutral Trend (50), all other sectors remaining in Long Term negative trend.
Gold is one of the winners of the week, this time in positive Long Term trend, with a Long Term score gaining 30 points, to 60 points now. His Short Term score also increased by 30 points (100).
The oil rebound was not enough to change the direction of its short term (10 points, negative trend then) and long term (0) scores.
Industrial metals and agricultural commodities remain generally misguided in both the short and long term. The Palladium (short-term score 90, long-term 100) and tin (short-term score 70, long-term 60) are an exception, having registered for several weeks in a positive trend.
The Bonds confirm their passage in positive trend Short Term, with a score of 64, up 6 points over the week, and are close to the same balance in the long term with a score of 46 (close to 50 so), which earns 8 points.
For several weeks bond ETFs such as AM3A (Amundi Govt Bond Highest Rated), AGEB (Amundi Global Emerging Bond) and C10 (Govt Bond EuroMTS Investment Grade) are well oriented in the short and long term.
Caution therefore because the context remains bearish on the Shares, but some indices are only a few points to find a positive Long Term trend. The time factor will be key, because without a quick and ample rebound, negative trends could strengthen in the long term.