SX5E - 27/05/19
Short Term trend: Positive (70/100)
Long Term trend: Negative (45/100)
(scores computed by our proprietary algorithms - see methodology)
to access to our Buy / Sell signals
on ETFs and Stocks
Index profile
This index is dominated by the Franco-German couple, which represents around 70% of the index's capitalization, the remaining 30% mainly for the southern European countries (mainly Italy and Spain) as well as the Benelux countries.
The 10 largest stocks represent around 36% of the index and have a very large market capitalization of around €100bn including 4 German companies (Siemens, SAP, Linde and Allianz) and 3 French (Total, Sanofi and LVMH).
The index is fairly balanced from a sector point of view, with the most represented being financials (17%), followed by Industry (13%), and cyclical consumer goods (12%) and durable (11%) as well as health (10%).
As far as Eurozone stocks are concerned, there is no direct currency risk, however, for large global companies there is sensitivity to currencies including Euro / dollar in first place.
The Euro Stoxx50 is representative of the euro area economy because of its sector weighting, which is less favorable to energy than in some national indices (such as the CAC40), while the financial sector (banks + insurance) remains a key compartment but does not reach the weight of the Italian or Spanish indices (around 33%).
The volatility of the Euro Stoxx50 is rather lower than that of the national indices, due to geographical diversification, the absence of sectoral bias and the greater inertia due to the size of the market capitalizations. If we compare the Eurostoxx50 with the Stoxx600, we will find a much more concentrated index on the core of the euro zone and large market capitalizations, also narrower geographically due to the absence of the United Kingdom, Switzerland and the Nordic countries.
The Euro Stoxx50 fell by 14.3% in 2018 but rebounded 11.6% in 2019 compared to a rise of 13.4% for the stoxx600 after a drop of 10.7% in 2017.
The Eurostoxx50 is weakened by the absence European dynamics, and a growing trade and strategic war between China and the US, while Germany, the economic engine of the euro area remains highly dependent on exports to two countries.
Technical analysis
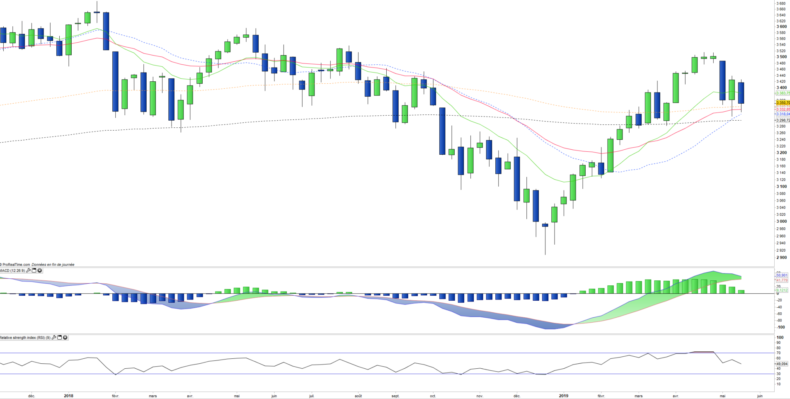
Weekly data analysis
The weekly chart shows a dynamic that is dulling since the peaks of March / April, but the correction has been stopped for the moment by the level of 3320 pts which corresponds to a confluence of moving averages. This support is major and its penetration confirmed at the weekly level would be significant, meaning the reversal of the downward trend.
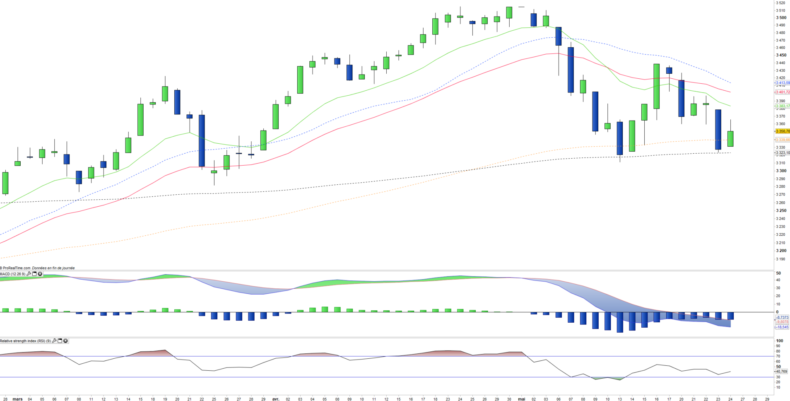
Daily data analysis
On the daily chart, we can observe that prices are just on the major support materialized by the EMA100 and are at the same time "capped" by the EMA20. Prices will quickly get out of this triangle, with renewed volatility if it is a break in support. The index will have to quickly choose its side, which should make the trend more directional in the coming weeks.
Country Breakdown
| France | 39% |
| Germany | 32% |
| Netherlands | 10% |
| Spain | 10% |
| Italy | 5% |
| Belgium | 3% |
| Others | 1% |
Sector Breakdown
| Financials | 17% |
| Industrials | 13% |
| Consumer discretionary | 12% |
| Consumer staples | 11% |
| Information technology | 11% |
| Materials | 9% |
| Health Care | 9% |
| Others | 18% |
Top Ten Holdings
| Total | 5% |
| SAP | 5% |
| Linde | 4% |
| LVMH | 4% |
| Allianz | 4% |
| Sanofi | 4% |
| Siemens | 3% |
| Unilever | 3% |
| ASML Holding | 3% |
| Airbus | 3% |


