Lyxor Euro Stoxx50 Net Return (MSE) - 22/01/2018
Short Term strategy : Positive (90%) / Trend +
Long Term strategy : Positive (95%) / Trend +
Characteristics of the ETF
The MSE ETF (Lyxor) replicates the European benchmark EURO Stoxx50 Net Return, which is composed of the 50 largest stocks belonging to the Eurozone member countries, selected on the basis of their market capitalization, liquidity and market value and sectoral representativeness. The index strives to maintain a weighting by country and by economic sector reflecting at most the economic structure of the Euro Zone.
The ETF MSE replicates the Euro Stoxx50, with a fee of 0.2% and with an AUM of € 7 538m. The replication method is direct (physical) and there is a policy of semi-annual distribution of dividends.
Alternative ETFs: EUE (iShares in Euro), C50 (Amundi in Euro).
Index & components
This index is dominated by the Franco-German couple, which represents around 70% of the index's capitalization, the remaining 30% mainly for the southern European countries (mainly Italy and Spain) as well as the Benelux countries.
The 10 largest stocks represent around 37% of the index and have a very large market capitalization of around €100bn including 6 German companies (Siemens, SAP, Bayer, BASF, Allianz and Daimler) and 3 French (Total, Sanofi and BNP).
The index is fairly balanced from a sector point of view, with the most represented being financials (23.1%), followed by Industry (15.2%), and cyclical consumer goods (11.7%) and durable (10.3%) as well as Health Care (8.9%).
As far as Eurozone stocks are concerned, there is no direct currency risk, however, for large global companies there is sensitivity to currencies including Euro / Dollar in first place.
The Euro Stoxx50 is representative of the Euro area economy because of its sector weighting, which is less favorable to energy than in some national indexes (such as the CAC40), while the financial sector (banks + insurance) remains a key compartment but does not reach the weight of the Italian or Spanish indices (around 33%).
The volatility of the Euro Stoxx50 is rather lower than that of the national indexes, due to geographical diversification, the absence of sectoral bias and the greater inertia due to the size of the market capitalizations. If we compare the Euro stoxx50 with the Stoxx600, we will find a much more concentrated index on the core of the Euro Zone and large market capitalizations, also narrower geographically due to the absence of the United Kingdom, Switzerland and the Nordic countries.
The political cycle remains an important parameter for the zone and has been particularly favorable for the moment, with the victory of the liberals in the Netherlands and then in France, and in principle a large coalition in Germany. The main political risk of the Eurozone remains Spain, which must face the Catalonia ambitions for independence while Italy must vote on March 4, 2018.
Latest developments
The Euro Stoxx50 recorded in 2017 an increase of 9.6%, a little lower than that of the Stoxx600 (+ 10.6%) which benefited from the rise of the Nordic countries.
The year 2018 begins strongly, with growth already reaching 4.2% driven by excellent economic statistics (Markit PMIs and the household and business confidence index at the highest) and the earnings outlook for companies, whose growth is estimated at 10% in 2018.
Another good news has just been released: it is the positive vote of the SPD for the formation of a grand coalition with the CDU / CSU which was not a given. This vote will allow Europe to restart and make progress on the reforms.
The negative point in the short term will certainly be a new strengthening of the Euro / Dollar, especially as in the US the shutdown of the government was announced this WE.
The index is currently benefiting from the strong momentum of cyclical sectors, such as the automotive, energy, chemicals sectors, and financials, which are benefiting from the prospect of rising interest rates.
Monthly data
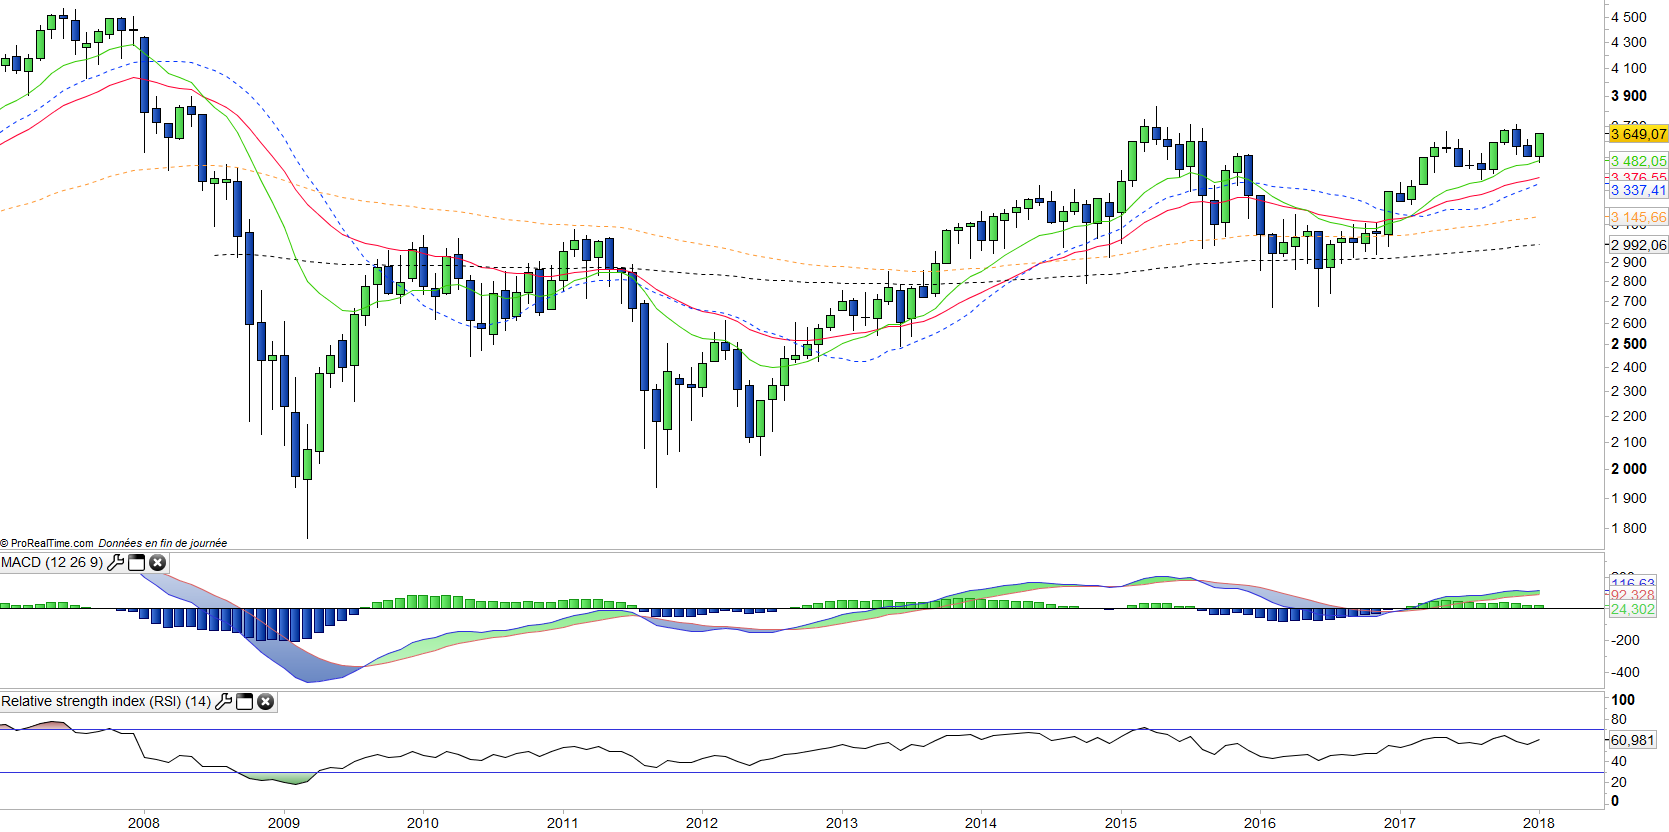
The monthly chart shows a long-term uptrend and acceleration after the rebound on the EMA13 which resulted in the formation of a positive candlestick in January (to be confirmed in monthly closing). This trend gives no sign of weakness and there is no tension on the technical oscillators, therefore the upside potential is significant and the trend should continue to the peaks of 2015 at first place.
Weekly data
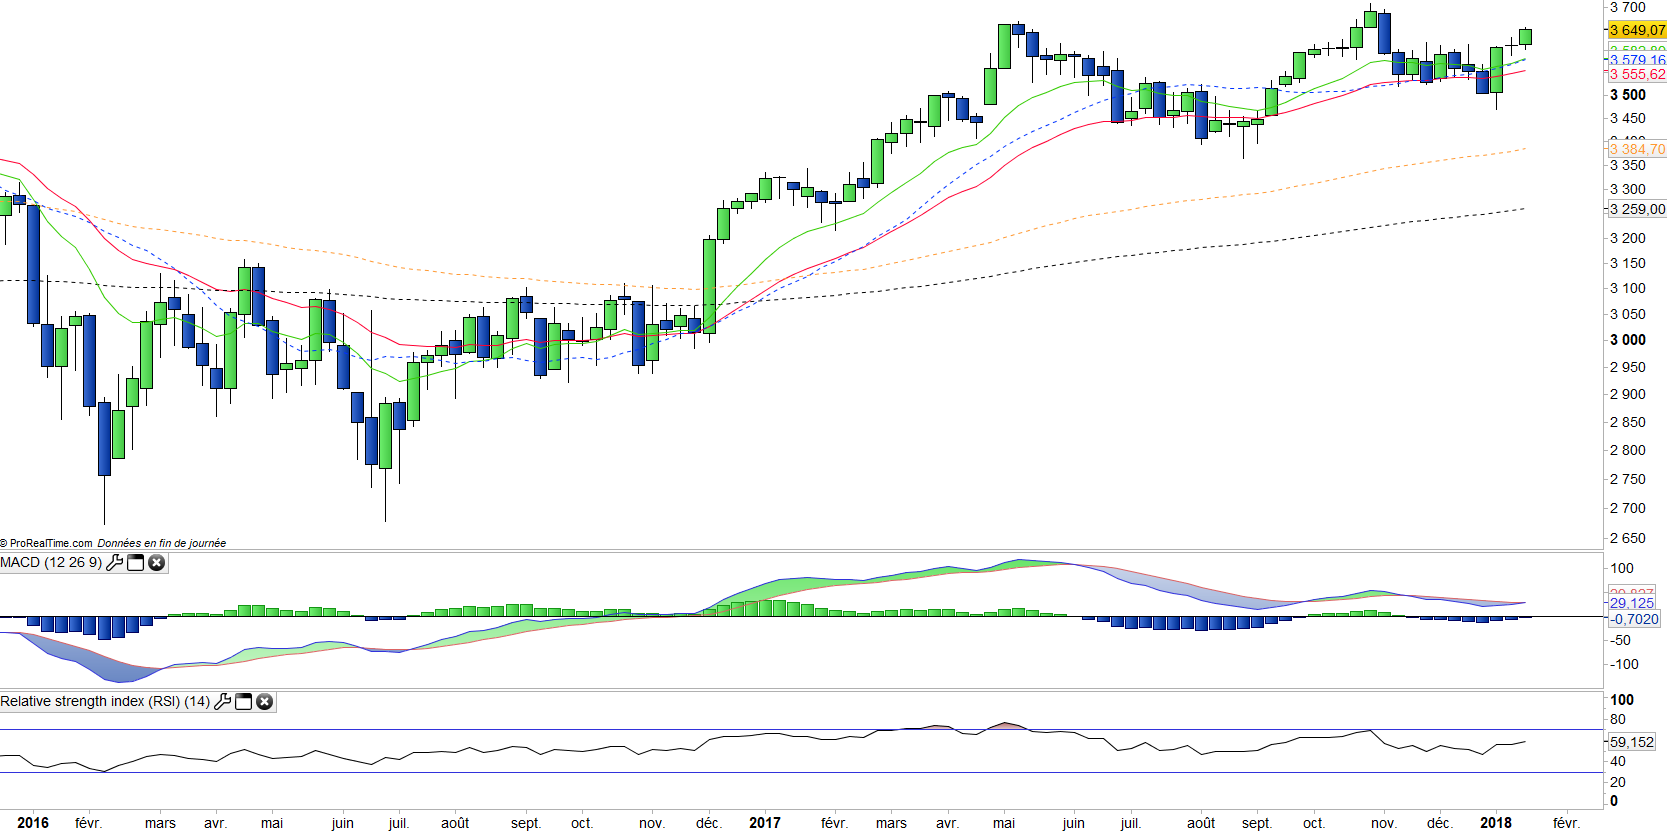
On the weekly chart, the indicators are also bullish and the prices are coming soon in a zone of resistance located at 3 700 pts then to 3 800 pts that will have to cross before tackling the historical highs of 2007 which are still far away at 5 500pts. The MACD seems about to turn upward, a positive point to monitor in the coming days.
ETF Objective
MSE is a UCITS ETF which seeks to replicate the EURO STOXX 50 Net Total Return Index
Characteristics
| Inception date | 19/02/2001 |
| Expense ratio | 0,20% |
| Benchmark | Euro Stoxx 50 Net Return |
| Issuer | Lyxor |
| Ticker | MSE |
| ISIN | FR0007054358 |
| UCITS | Yes |
| EU-SD status | Out of scope |
| Currency | € |
| Exchange | Euronext Paris |
| Assets Under Management | 7 553 M€ |
| Replication method | Direct (Physical) |
| Dividend | Distribution |
| PEA (France) | Yes |
| SRD (France) | Yes |
| Currency Risk | No |
| Number of Holdings | 50 |
| Global Risk | 3/5 |
Country Breakdown
| France | 36% |
| Germany | 33% |
| Spain | 10% |
| Netherlands | 7% |
| Italy | 5% |
| Belgium | 3% |
| United Kingdom | 3% |
| Others | 3% |
Sector Breakdown
| Financials | 23% |
| Industrials | 15% |
| Consumer Discretionary | 12% |
| Consumer Staples | 10% |
| Health Care | 9% |
| Information Technology | 7% |
| Materials | 7% |
| Others | 17% |
Top 10 Holdings
| Total | 5% |
| Siemens | 4% |
| Banco Santander | 4% |
| SAP | 4% |
| Allianz | 4% |
| BASF | 4% |
| Bayer | 3% |
| Sanofi | 3% |
| BNP Paribas | 3% |
| Daimler | 3% |