The MEUD ETF (Lyxor) created in 04/2013 replicates the STOXX600 Net Return index which is composed of the 600 largest European stocks representative of the main sectors, while the stocks of the Euro zone represent approximately 53% of the index, there is therefore a significant exposure to other European currencies, in particular the British Pound and the Swiss Franc.
The fees of the ETF MEUD are quite low at 0.07% and the AUM is €1353M. Replication is direct (physical) and there is a dividend capitalization policy.
Alternative ETFs: C6E (Amundi in Euro), ETZ (BNP Theam in Euro), EXSA (iShares in Euro)
Latest developments
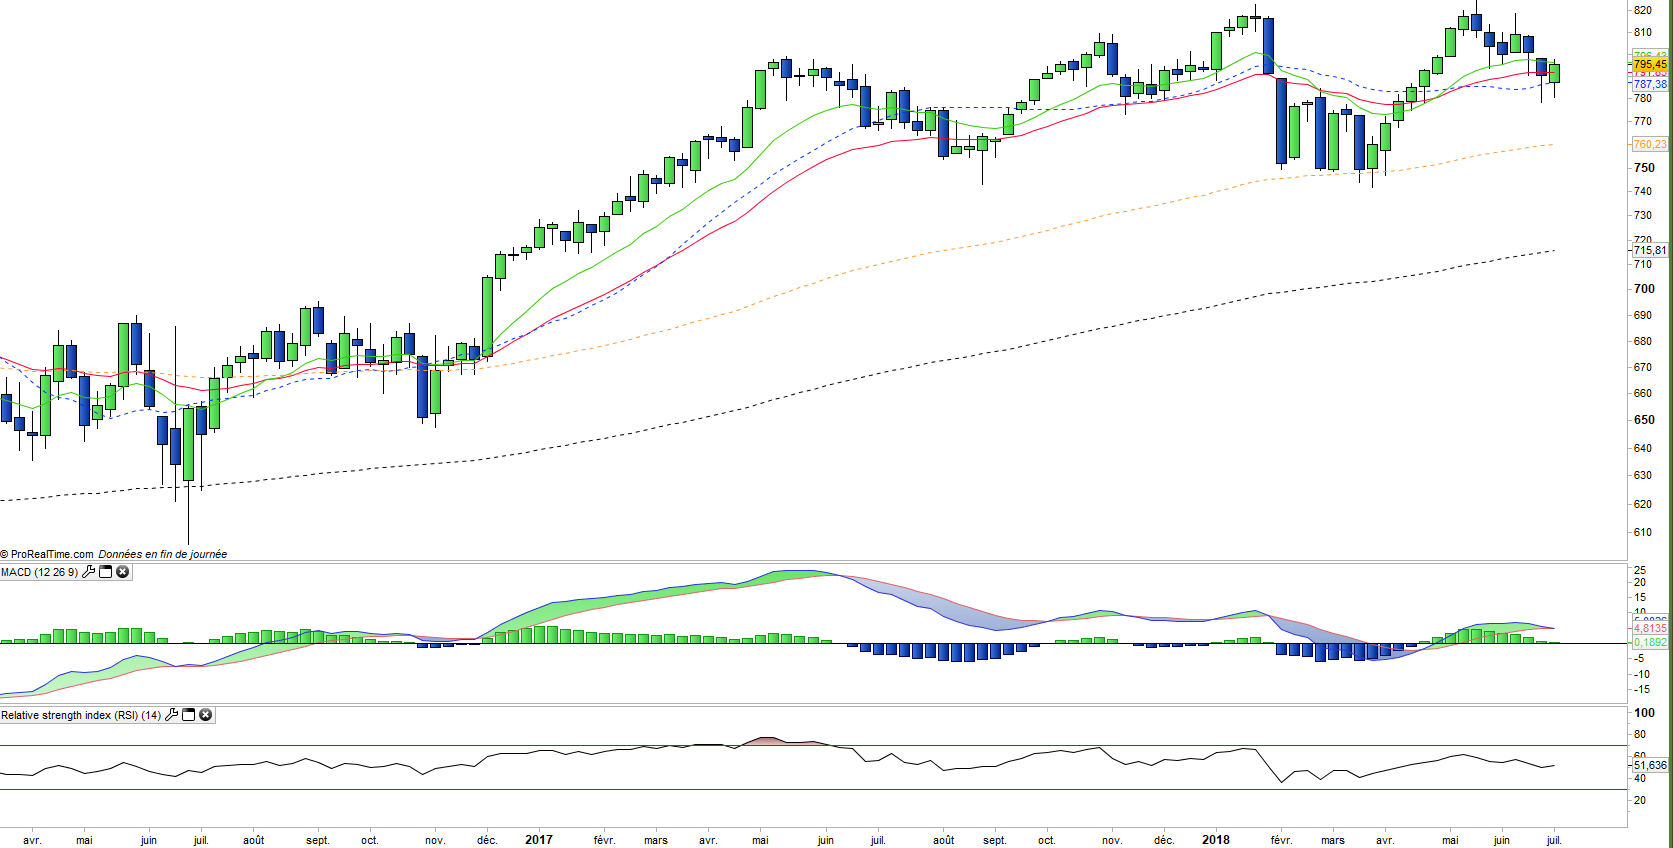
The Stoxx600NR finished the year 2017 on a rise of 10.6% justified by the double-digit corporate profits growth.
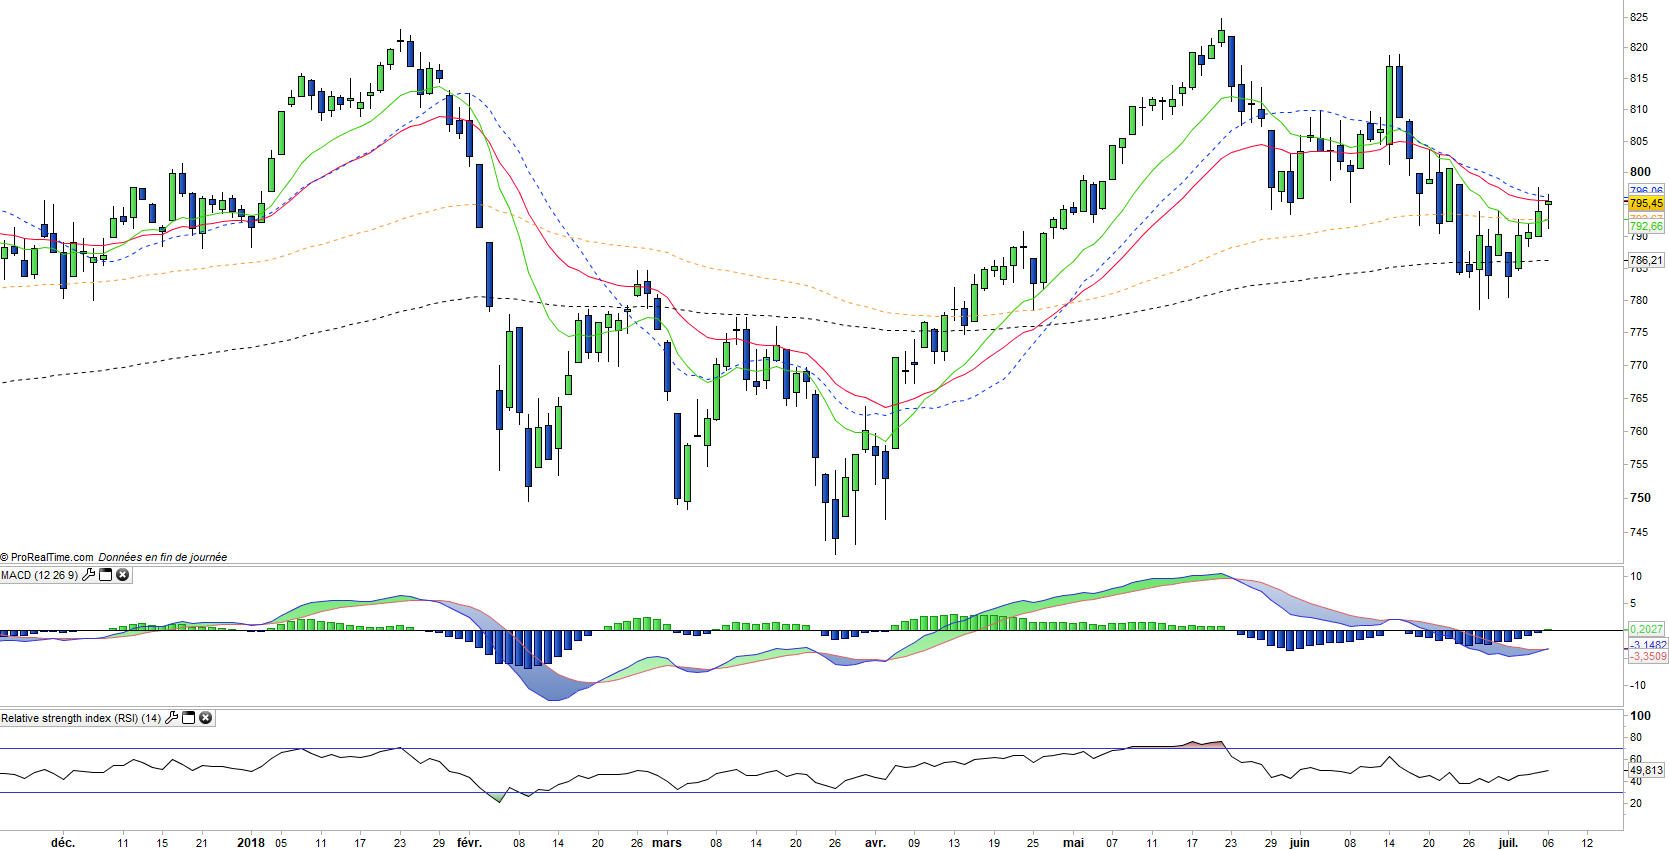
The year 2018 translates for the moment by a stability of the index (+ 0.3%), which reflects the fears of commercial war provoked by the United States and which could impact key sectors like automotive.
Political uncertainties remain, with a German coalition very weakened by the migrant crisis, a populist government in Italy and an ever more uncertain Brexit. However, the economic cycle remains well oriented and corporate earnings are once again expected to rise by 8 to 10% this year while valuations remain reasonable at around 15x current earnings.
The downside potential seems limited but volatility could increase depending on events, particularly related to the trade war that is now on between China and the US.
Index & components
The MEUD (Lyxor) tracker replicates the European benchmark, which enjoys a very important depth with 600 holdings and a great diversity by its exposure to the main sectors and countries of the European Union, including outside of the eurozone.
This index is a benchmark for the European markets, and we analyze its stock market behavior with great attention because the evolution of this index partly conditions our sectoral and geographic strategy.
The index is fairly balanced in its weighting with 4 major sectors that represent two thirds of the capitalization. In the first position is the cyclical and sustainable consumer goods sector (23.6%), which includes food giants such as Nestlé or AB-Inbev, as well as luxury, cosmetics and ready-to-wear brands like LVMH or Inditex as well as the automotive sector; financial (19.8%) industry (13.8%) and health (12.8%). In this index, energy-related values represent only 7.1% and raw materials 8.2%.
In addition, it should be noted that there is a certain level of currency risk in this index consisting of 24.8% of British securities and 12.8% of Swiss securities, even if the securities concerned are international and fairly exposed to the dollar.
The STOXX600 is very representative of the European economy because of its sector weighting, which is less favorable to oil than in some national indices (like the CAC40), while the financial sector (banks + insurance) remains a key compartment with c.20% of the weighting but without reaching the weight of the Italian or Spanish indices (c.33%). This balanced weighting allows MEUD to have lower volatility than the national indices, as this index is much more diversified and without sector bias.
The ETF MEUD has the advantage of replicating a broader index than the Eurostoxx50 and which also incorporates smaller capitalizations, but with a more dynamic path. The European economic cycle is currently being strengthened, which is validated both by the PMIs datas and also the results of companies above expectations. The ECB remains a factor of stabilization and the monetary normalization should be very progressive in the absence of inflation and despite the Bundesbank which would like a more restrictive policy, and the pressure linked to the rise in US long-term rates.