The MSE ETF (Lyxor) replicates the European benchmark EURO STOXX 50 Net Retun, which is composed of the 50 largest stocks belonging to the Eurozone member countries, selected on the basis of their market capitalization, liquidity and market value and sectoral representativeness. The index strives to maintain a weighting by country and by economic sector reflecting at most the economic structure of the Euro zone.
The ETF MSE replicates the Euro Stoxx50, with a fee of 0.2% and with an AUM of € 6540m. The replication method is direct (physical) and there is a policy of semi-annual distribution of dividends.
Alternative ETFs: EUE (iShares in Euro), C50 (Amundi in Euro).
Index & components
This index is dominated by the Franco-German couple, which represents around 70% of the index's capitalization, the remaining 30% mainly for the southern European countries (mainly Italy and Spain) as well as the Benelux countries.
The 10 largest stocks represent around 36% of the index and have a very large market capitalization of around €100bn including 5 German companies (Siemens, SAP, Bayer, BASF and Allianz) and 3 French (Total, Sanofi and LVMH).
The index is fairly balanced from a sector point of view, with the most represented being financials (19,7%), followed by Industry (13,8%), and cyclical consumer goods (11.3%) and durable (10.8%) as well as health (11%). As far as Eurozone stocks are concerned, there is no direct currency risk, however, for large global companies there is sensitivity to currencies including Euro / dollar in first place.
The Euro Stoxx50 is representative of the euro area economy because of its sector weighting, which is less favorable to energy than in some national indices (such as the CAC40), while the financial sector (banks + insurance) remains a key compartment but does not reach the weight of the Italian or Spanish indices (around 33%). The volatility of the Euro Stoxx50 is rather lower than that of the national indices, due to geographical diversification, the absence of sectoral bias and the greater inertia due to the size of the market capitalizations.
If we compare the Eurostoxx50 with the Stoxx600, we will find a much more concentrated index on the core of the euro zone and large market capitalizations, also narrower geographically due to the absence of the United Kingdom, Switzerland and the Nordic countries.
The political cycle remains an important parameter for the zone and has been particularly favorable for the moment, with the victory of the liberals in the Netherlands and then in France but Germany is now weakened by a coalition that has become very fragile. The situation has not changed favorably in Italy, which is now governed by an antisystem coalition and in Spain, with a socialist government weakened by the lack of a majority in the assembly.
Latest developments
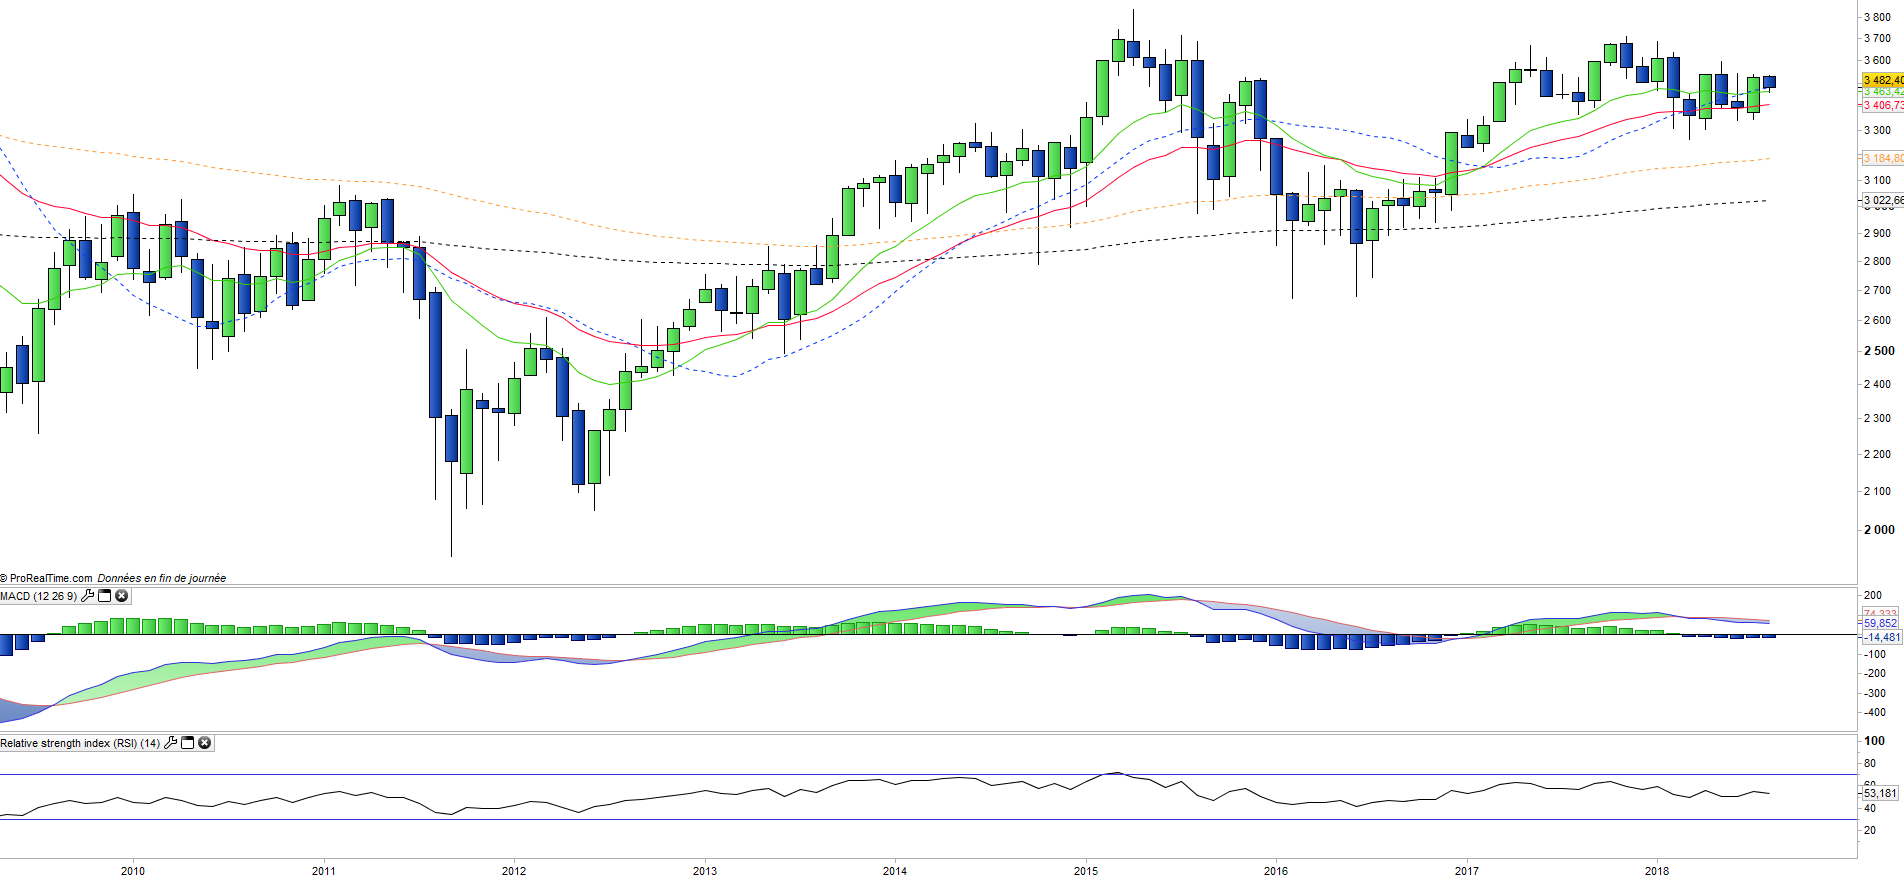
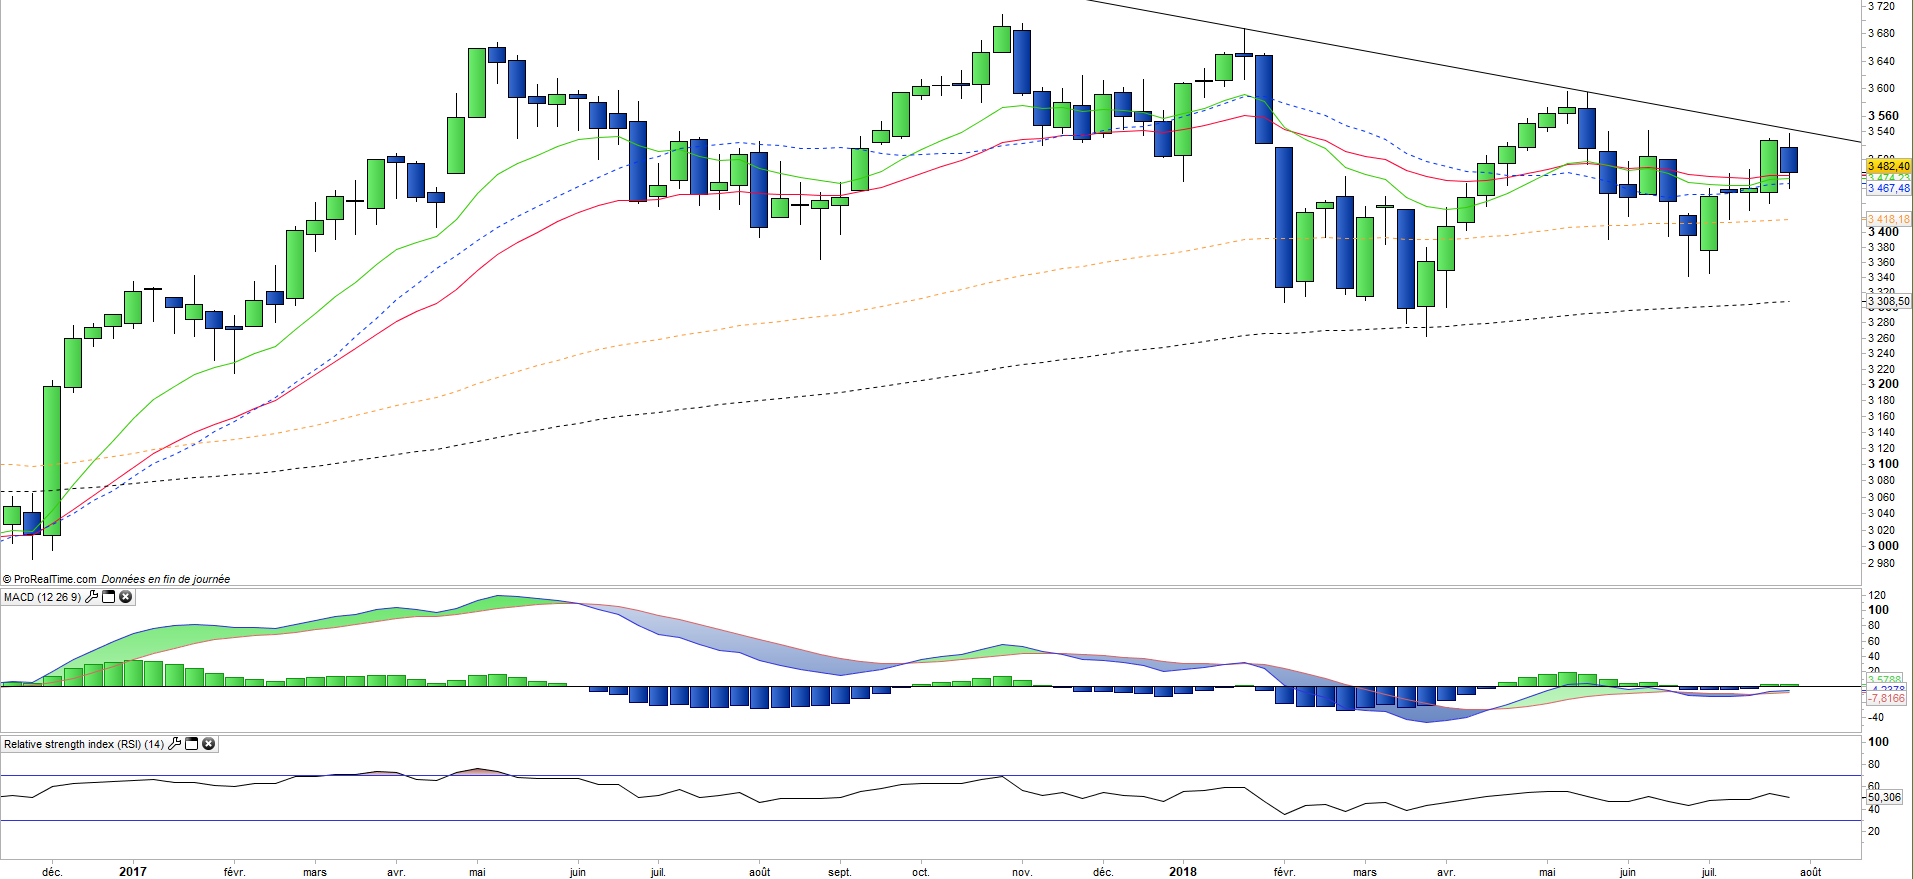
The Euro Stoxx50 rose 6.5% in 2017 but is currently down 0.6% in 2018 compared with a rise of 2.2% for the stoxx600.
The Eurostoxx50 has been penalized by political uncertainties from Germany and southern Europe (Italy and Spain) while Germany is also under pressure due to the protectionist actions of D.Trump that could target the automotive sector in the coming weeks despite a hope of agreement that remains to be confirmed.
However, corporate results continue to carry the trend with Q2 better than expected and coupled with favorable macroeconomic factors (favorable euro / $, low interest rates and oil at moderate level). The major uncertainty now concerns the trade war waged by D.Trump which targets Europe as much as China.