The SPY ETF (SPDR) created in 01/1993 replicates the S & P 500 index, which is composed of the 500 main US stocks representative of the main sectors, while the stocks are selected according to the size of their market capitalization.
The ETF fees are low at 0.0945% and the AUM is $ 255bn. Replication is direct (physical) and there is a dividend distribution policy on a quarterly basis.
Index profile
The top 10 stocks of the S&P500 include five major technology stocks (Apple, Amazon, Microsoft, Alphabet and Facebook), but also larger, more classic and iconic American companies such as JPMorgan or Exxon Mobil. The main benefit of this index is its depth, which allows it to be a good proxy for the US economy, with a sector weighting that favors the growth sectors a little more, just like the technology stocks that represent about 20% of the weighting. Financial stocks account for just over 13% of the index and energy stocks around 5% are well balanced by defensive sectors such as health (around 15%) and consumer discretionary (10%). ).
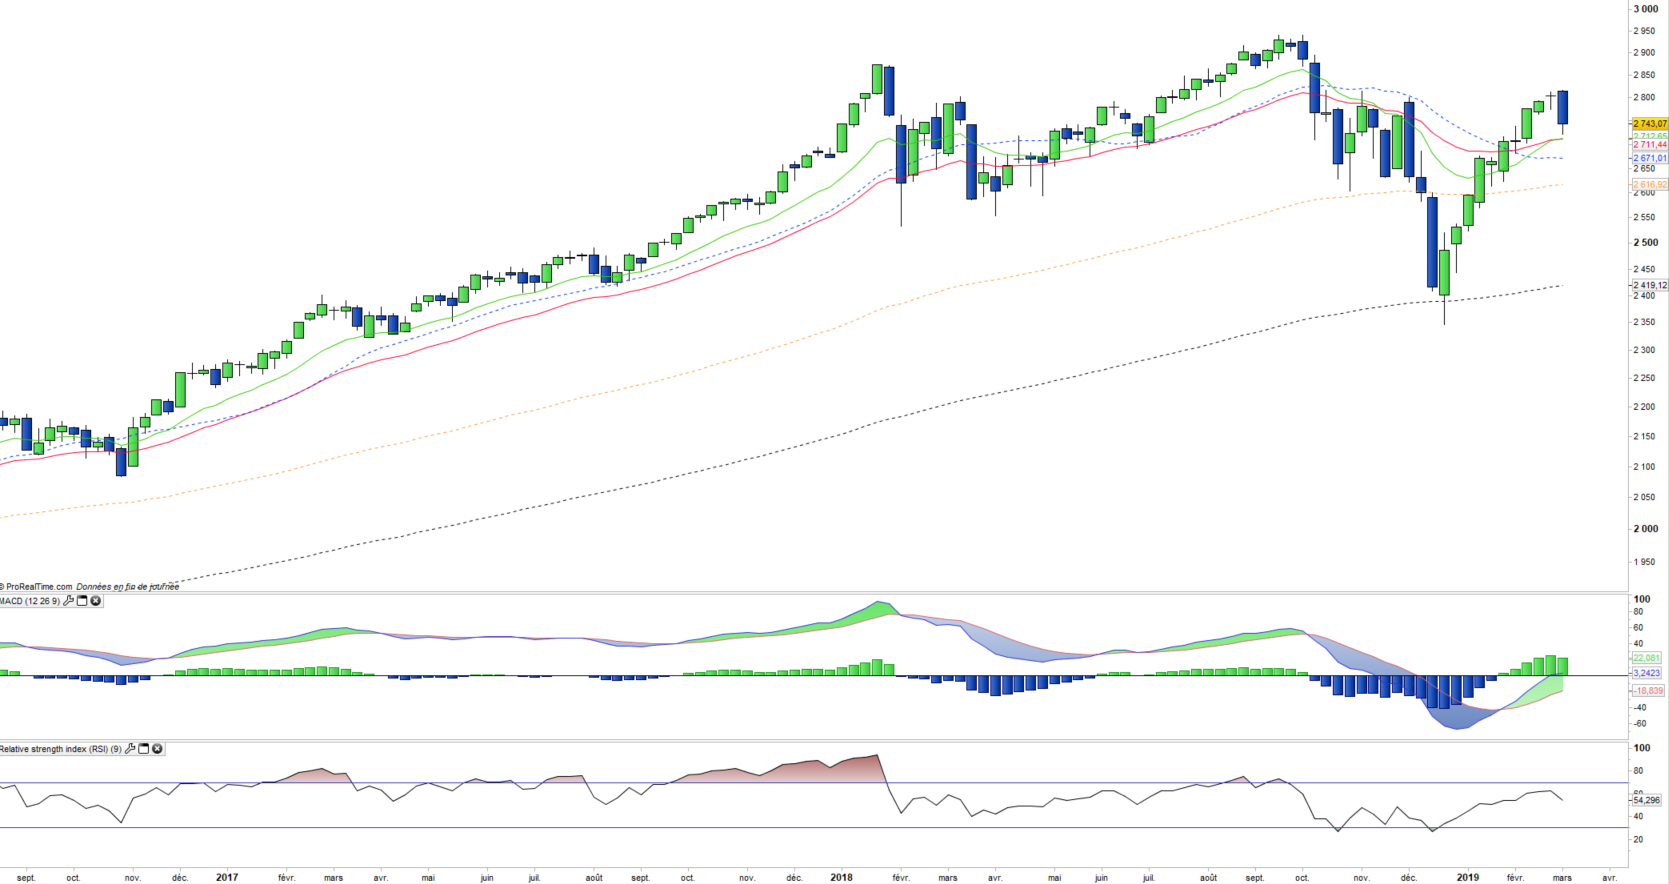
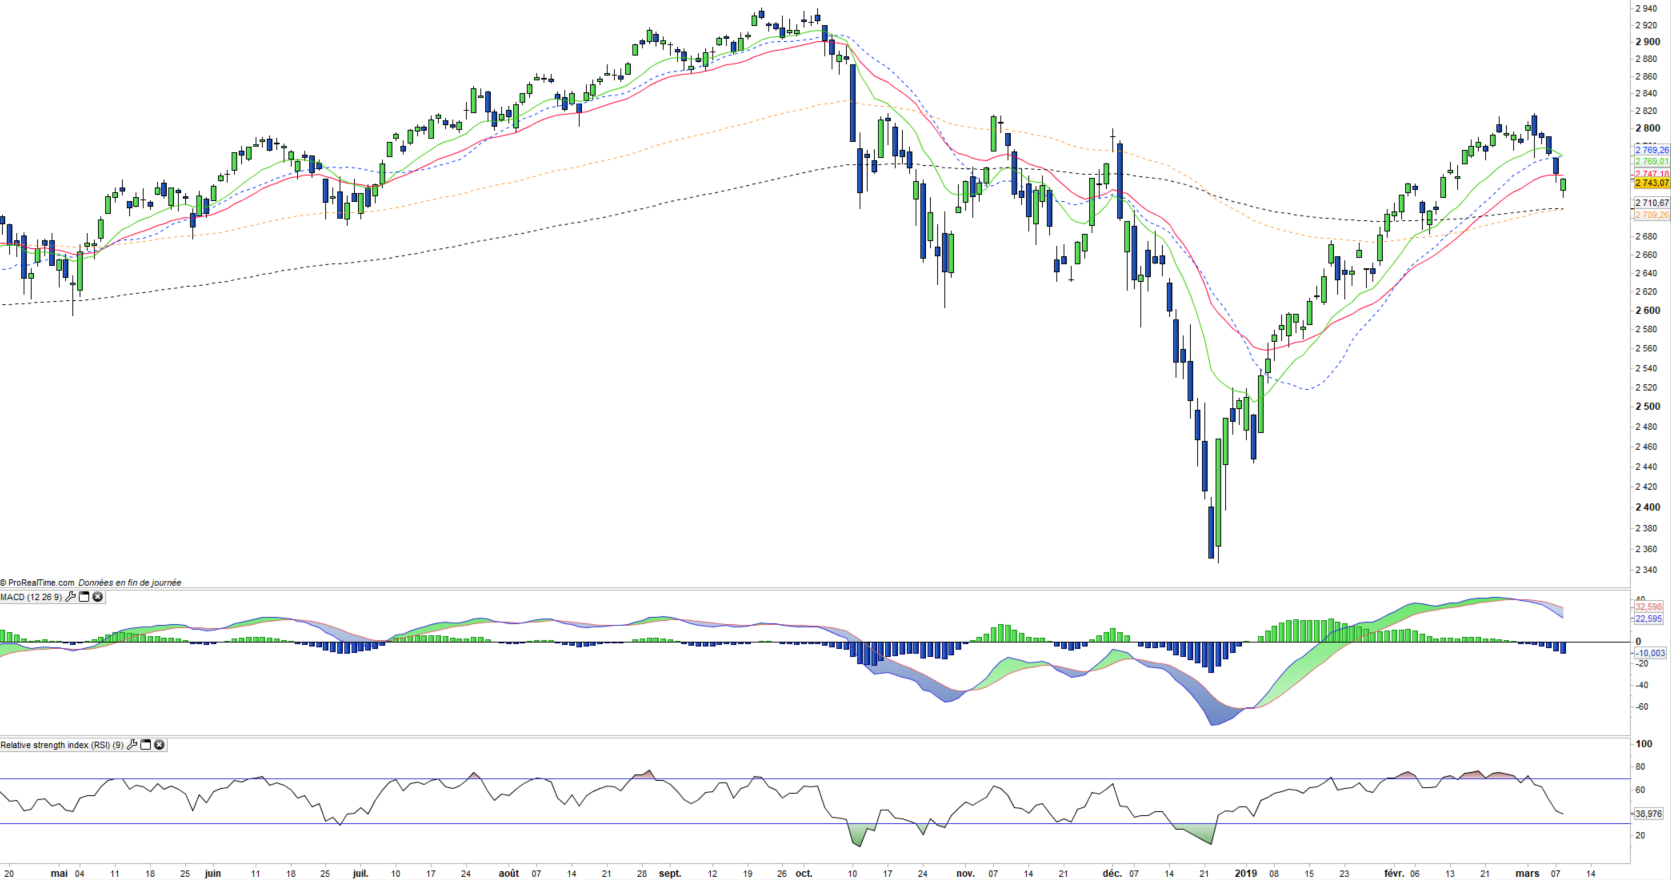
After a 19.4% rise in 2017, the S&P500 posted a -6.2% drop in 2018 due to expectations of an economic downturn related to the worsening trade war between the US and China and a at the same time, interest rate increases by the FED. The index rebounded 9.4% in 2019 due to a change of course of the FED which no longer plans to raise rates in the short term, and a probable deal between the US and China on March 27 in Florida. In addition, corporate results were rather reassuring in the fourth quarter with reasonable growth prospects in 2019. The S&P500 is well valued at 19x earnings, which leaves little room for growth for earnings growth expected in the near future + 5% this year.
ETFs alternatifs : AUM5 (Amundi en Euro), SP5 (Lyxor en Euro), IVV (iShares, en USD)
Nous sommes acheteurs de l'indice (Alerte haussière du 22/01/19)