The ONEQ (Fidelity) ETF created in 09/2003 and listed in USD seeks to replicate the Nasdaq Composite Index. The fund consisting of 977 stocks normally invests at least 80% of the assets in equities included in the index and uses statistical sampling techniques that take into account factors such as capitalization, sectoral exposures, dividend yield, price / earnings ratio, and earnings growth to create a portfolio of securities with an investment profile similar to the overall index.
ETF fees are fairly low at 0.21% and AUM is significant at $ 1.47bn. Replication is direct (physical) and there is a dividend policy.
Alternative ETFS: N / A
Index & components
ONEQ is a radical supporter of technology companies, the dominant sector of the Nasdaq market, to the detriment of energy, industry and finance. The large weightings of large cap technology companies, such as Apple and Microsoft, increase the risk of exposure to individual stocks. Just like the market it aims to follow, ONEQ is essentially a growth ETF, with higher multiples and lower dividends. However, it is an index less focused on large stocks than the Nasdaq100, so the top 10 stocks in the index including Apple, Amazon, Alphabet, Facebook and Microsoft account for about 35% of the market capitalization of the index (compared to 53 % for Nasdaq100) while Apple alone represents more than 8% of the index (against 12% for Nasdaq100).
The interest of this index lies in the fact of taking a diversified bet by always doing a good part to the "GAFA" (Google, Apple, Facebook and Amazon) but less concentrated than on the Nasdaq 100. The index remains however particularly influenced by Apple's prices fluctuate based on the success of its new smartphones. It should be noted that large technology stocks have generally performed very well since the beginning of 2017, in particular GAFAs, but this is also the case for the whole semiconductors and e-commerce sector. Large biotech stocks, such as Gilead and Amgen, have been under increased pressure for many months, reflecting uncertainties in both their pipeline and US health policy, as well as speculative bonuses after the failure of major transatlantic operations. However, the attractiveness of US biotech companies remains significant at a national level, and these are prime targets for major US laboratories, as well as an alternative to transcontinental operations.
The volatility of the index is not very marked, which reflects the considerable weight of market capitalizations often above $ 300 billion for the top 10 companies, see $ 500 billion for the top 5. But the Nasdaq Composite is not just about its top 10 stocks, and the depth of the index makes it possible to invest in companies already established but still with a strong potential for appreciation such as Tesla, Xilinx or Symantec.
The hegemonic position of the GAFA in the world begins to provoke reactions, especially in Europe, both on competitive positions or abuse of dominant positions could trigger heavy fines, as seems to be emerging for Google, but also on taxation while European countries seek to find an agreement to tax the revenues generated on their territory. Chinese competitors are becoming more present, such as Alibaba or Tencent with GAFA equivalent market capitalizations and could threaten the supremacy of the American technology leaders.
Latest developments
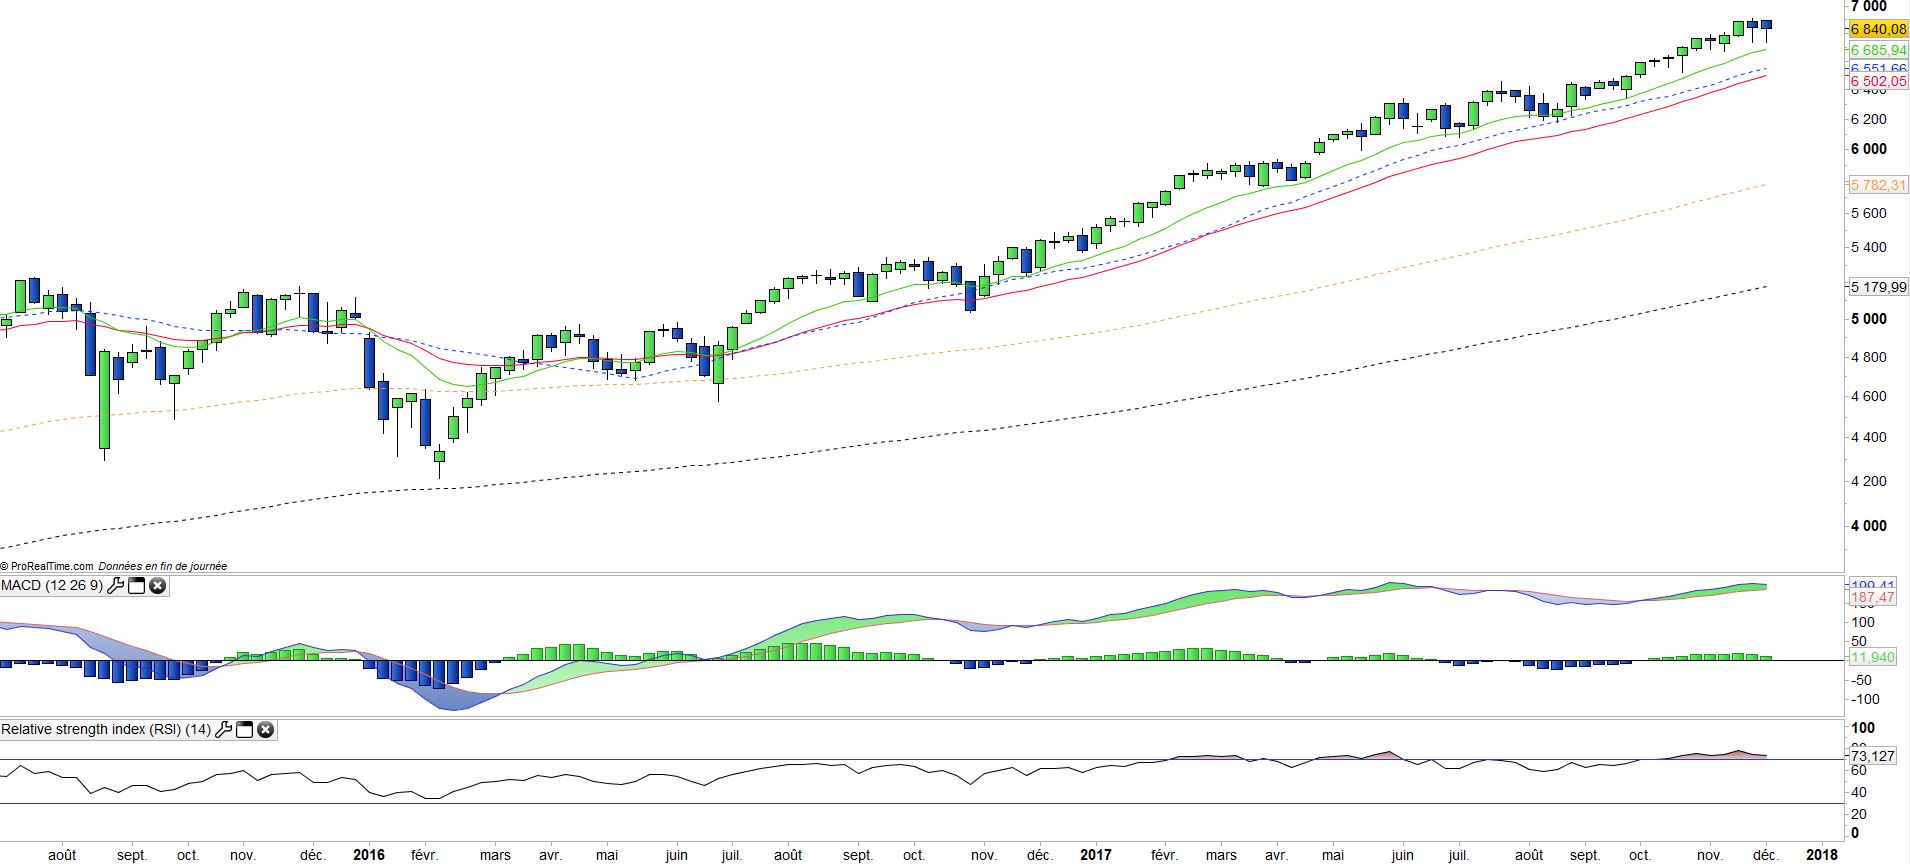
The Nasdaq Composite has risen 27.1% since the beginning of 2017. This is the highest annual increase since the time of the technology bubble between 1998 and 2000. However, at the time the index had risen by 39% in 1998 and 86% in 1999, ie more than 3 times more than at the end of 1997 and the March 2000 peak of 5132pts. Nothing like this time, the index has certainly tripled since the end of 2009 therefore in 8 years but if the valuations are high, this is nothing like the past period and the 12-month PER is currently 32X while the progression results should be more than 10% in 2018, which remains acceptable especially since the cash positions of companies are often important especially for the 10 large stocks.
The sustainability of the pace of growth of large-cap stocks may, however, be questioned, but the depth of the index should prompt the emergence of new topics such as blockchain, robotics and artificial intelligence while biotechnology and the medtech sector also offer great potential.