AAPL - 13/03/19
Short Term Trend: Positive (80/100)
Long Term Trend: Positive (100/100)
(Scores computed by our proprietary algorithms)
We buy Apple (injected in our Growth Dollar Portfolio on 13/03/19)
to access to our BUY /SELL
signals on Stocks, ETFs & Indices
Company Profile
Apple is an iconic technology company of the Silicon Valley, and is among the top 5 Nasdaq stock market capitalisations with Amazon, Facebook, Google and Microsoft (GAFAM).
Apple derives most of its revenue from the sale of smartphones, tablets and PCs and seeks to diversify into services (music and corporates in particular).
The company has an operating margin of about 25% and a "cash pile" of over $ 100bn. The stock is listed in USD on the Nasdaq.
Revenue 2019 : 255Md$ / Revenue 2020 : 266 Md$
EBIT 2019 : 63Md$ / EBIT 2020 : 66Md$
Net Result 2019 : 53Md$ / Net Result 2020 : 55Md$
Net cash 2019 : 101Md$/ Net cash 2020 : 95Md$
Dividend 2019 : 3.1$ / Dividend 2020 : 3.40$
Market Capitalization : 853Md$
PER 2019 : 15.9x /PER 2020 : 14.2x
(Data estimated)
Risks/opportunities
The stock was under pressure at the end of 2018, with a decline of almost -40% in a straight line between October 1st and December 31st, due to concerns in the Chinese market and potential negative repercussions of the trade war between the US and China, both on company results as Apple achieves c.15% of its sales in China, and makes a large part of its growth in the country, but also has critical parts of its supply chain (including Foxcon).
The commercial failure of the latest smartphone launch due to (too)high price also raises questions about the limits of the company's business model.
However, the horizon is brightened by a likely agreement between China and the US, and a diversification in services that could become a significant growth driver in the medium term. The company has the means to make strategic acquisitions with more than $ 100bn in cash, and the valuation is very reasonable at about 15x 12month forward profits.
Technical Analysis
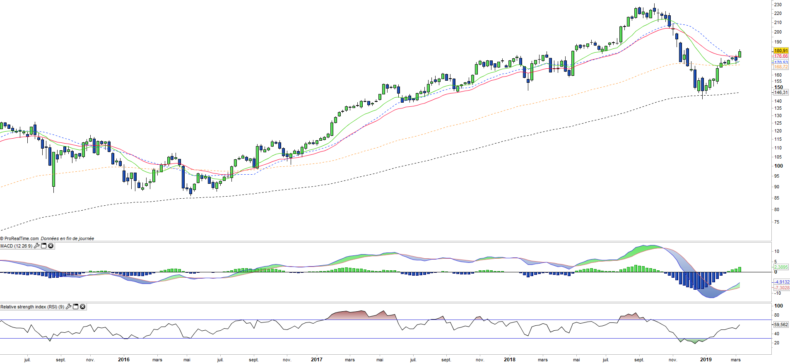
Weekly data
The weekly chart shows a bullish reversal and an acceleration of prices, which follows the crossing of the EMA26. The correction initiated at the end of 2018 is coming to an end and the stock resumes its medium-term bullish trajectory. The technical oscillators are following suit, with the RSI going well above the 50 mark, while the MACD is still far from its zero line, recovery is underway and price acceleration could occur.
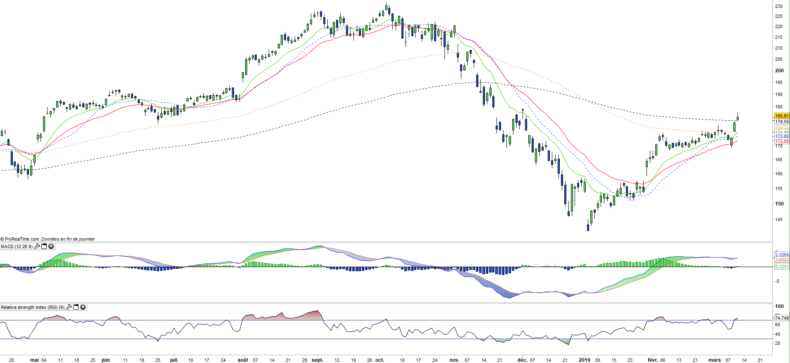
Daily data
On the daily chart, there is a visible acceleration of the short-term momentum following the crossing of the EMA100, which was the main short-term resistance. Prices are now entering a new step with the crossing of the EMA200, which confirms the resume of a positive trend. There is no visible overheating in the technical oscillators.


