The ACWU (Lyxor) UCITS ETF created in 09/2011 replicates the MSCI World all countries index, which is listed in USD and composed of 2790 representative securities from more than 50 countries, while the stocks are selected according to the size of their market capitalization. This ETF is quoted in Euro on Euronext and ETF fees are 0.45% for assets under management of €405bn. Replication is indirect (via swap) and there is a dividend capitalization policy.
Alternative ETFS: ISAC (iShares in USD)
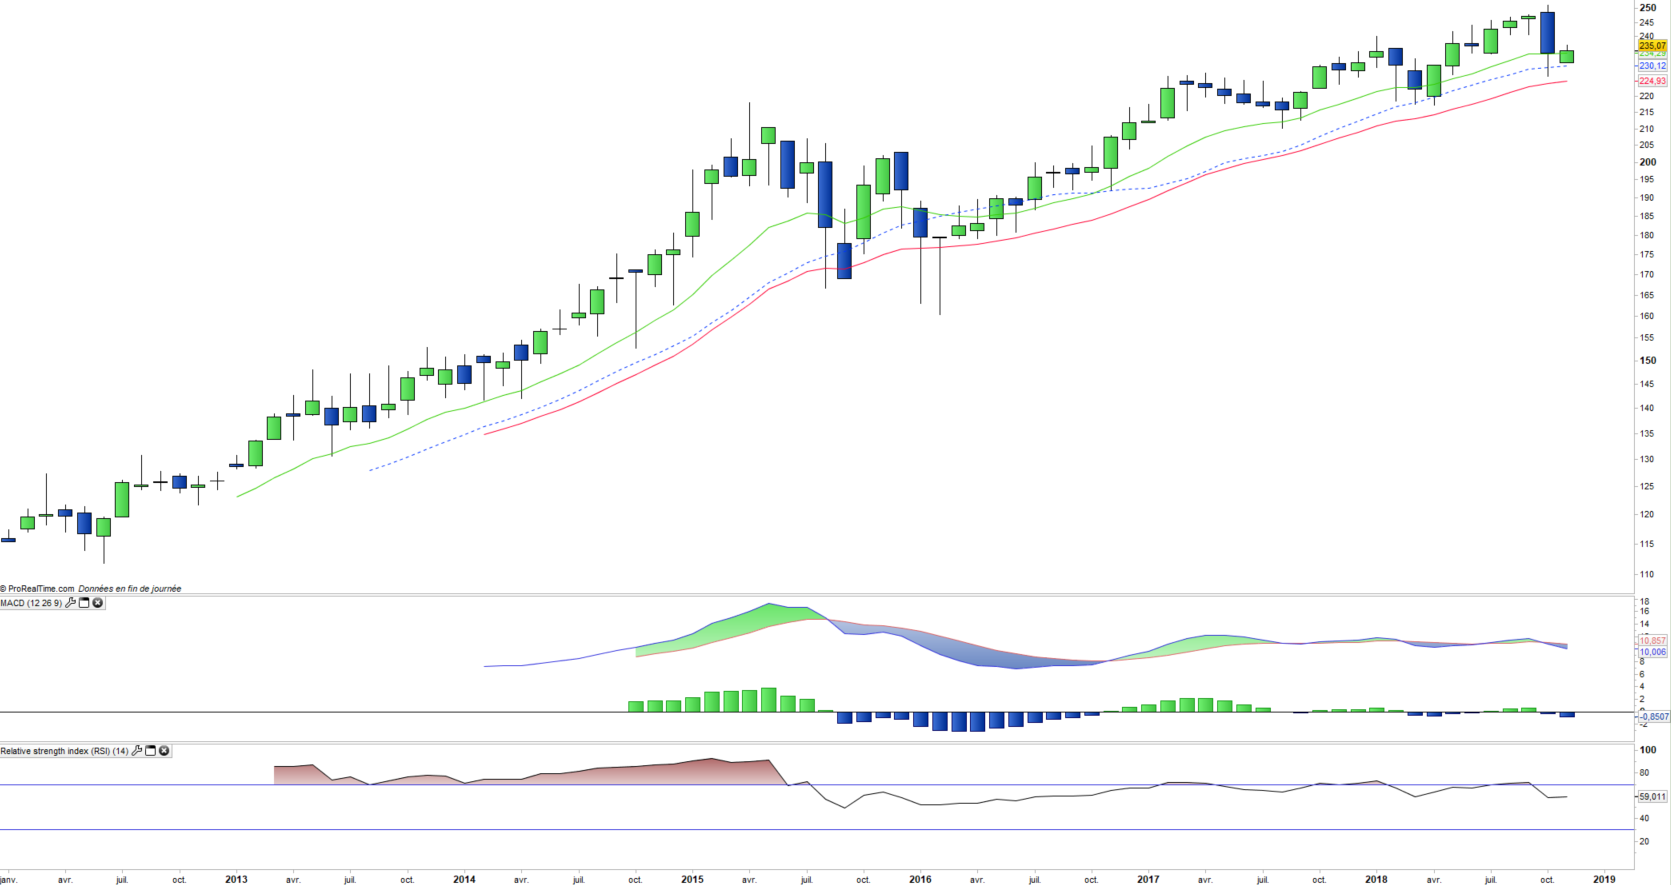
Latest developments
After an increase of 23.8% in 2017, the MSCI World index rose by only 1.76% in 2018, which is essentially linked to the strong momentum of the US since the beginning of the year, despite the current correction and more recently Latin America in the wake of the Brazilian elections. Note that the index in Euro is better oriented than in USD because of the strength of the dollar against other currencies. Europe is now in a bearish momentum, due to fears over Brexit and Italy. This is also the case of Asian markets, Chinese in particular. The resolution of the trade dispute between the US and China is key to the recovery of the index, however an agreement seems possible after the mid-term elections of November 6 while D.Trump is optimistic for the first time on the conclusion of an agreement from the end of November, indicating positive discussions and important progress with the Chinese side.
Index & components
The interest of this index is primarily its depth which allows it to be a good proxy for the world economy, but with a strong US weighting (54%) while China is under-represented at 4.5% if we include Hong Kong. All emerging countries represent around 12% of the index's capitalization, compared to 88% for developed countries, including 7% for Japan and 22% for Europe. The top 10 stocks of the MSCI World are major American stocks (Apple, Amazon, Microsoft, JP Morgan, Exxon ...), which represent 11% of the index.
Sector weighting further favors growth sectors, as do technology stocks that account for about 16% of the weighting. Financials represent 18% of the index and energy stocks 6%, which are well balanced by defensive sectors such as health (about 12%) and consumer discretionary (10%). The index has enjoyed strong momentum for two years, thanks to the very strong momentum of the US market which has accelerated after the election of D.Trump because of its policy of lower taxes and deregulation. However, in recent months, the dynamism of the US markets has become more difficult to drag the rest of the world because of the downward trend of the emerging-country indices which began in the spring with the decline in foreign currencies of some countries (Indonesia, South Africa) following the rise of the US dollar and US long-term rates, as a result of the economic war triggered by D.Trump ,. The US is currently the only area to pull the index up with Brazil that reversed up in the wake of presidential poll, despite global GDP growth estimated at nearly 4%.