Lyxor ETF Australia Spasx 200 (AU2) - 17/08/2018
Short Term strategy: Positive (100%) / Trend +
Long Term strategy : Positive (100%) / Trend +
Characteristics of the ETF
The ETF AU2 (Lyxor), created in 03/2010, replicates the S & P ASX200 index, which consists of the 200 largest Australian stocks that cover approximately 80% of the country's market capitalization. The index is weighted by floating capitalization.
The ETF's fees are slightly higher than the average of our sample and stand at 0.4% while the AUM amount to around 64M €. The replication method is indirect (via a swap), the ETF is quoted in Euro and the dividend payment policy is by distribution.
Alternative ETFs: EWA ( iShares in USD)
Index & components
This index is very deep and covers the bulk of the market capitalization of the country, so it is a very good proxy of the Australian economy.
The first 10 stocks are mainly composed of banks, while financials make up c.35% of the index, the other strongly represented compartment is mining / materials for c.18%, which includes the giant BHP Billiton (6.4% of the index).
We see Australia as a growth vehicle, as it is the only country in the OECD that has not experienced a recession during the financial crisis as the economy has experienced 26 consecutive years of growth. Growth reached 2.4% in 2015, despite the fall in coal and iron ore prices, which had a strong impact on exports, and the trend was more or less similar in 2016 and 2017 (+ 3%). This good performance can be explained by the broadening of the economy, following a relative slowdown due to the decline in Chinese demand for exports, particularly of minerals. The mining sector accounts for about 20% of GDP, but investments that have fallen due to falling prices are gradually recovering. Australia has other assets: a massive export of agricultural products, strong domestic demand and a robust financial sector.
Australia accelerates its integration with the Asia-Pacific region, while the country's main trading partners are Asia (China first), the United States and the European Union. Asia's share of trade with Australia is growing steadily. By 2014, Australia had signed a free trade agreement with China, in line with that agreement, Australia joined the Asian Investment Bank for Infrastructure, created by China in 2015.
So investing in the Australian index indirectly focuses on the development of the Asia (and China) zone through an Anglo-Saxon liberal country that is highly financialized but has a lot of natural resources, while population remain limited (approximately 25 million inhabitants). Australia's GDP is around $ 1,300 bn and roughly equal to the level of Spain or Russia, while per capita GDP is one of the highest in the world. The index is fairly volatile, but is steadily growing.
Latest developments
After a strong increase of 13.1% in 2016 and 5.3% in 2017, the index has recorded a new rise of 4.9% since the beginning of the year while the Australian dollar has stabilized compared to to the Euro (but fell sharply against the USD).
This good performance of the index is explained by a stabilization of the banking sector which stopped weighing negatively on the performance (Commonwealth Bank of Australia and Westpak Banking have rebounded significantly since May) trend reinforced by the Australian central bank, which has just announced the maintenance of its rates at 1.5% to allow the economy to continue to grow by about 3% in 2018 and 2019 which should cause an increase in inflation above 2%, a positive factor for the yield curve.
The index also benefits from the strong rebound in the mining sector (BHP Billinton + 11% since the beginning of the year). The Australian economy remains very dynamic despite its high exposure to China and commodities, in a context of trade war with uncertain consequences.
Monthly data
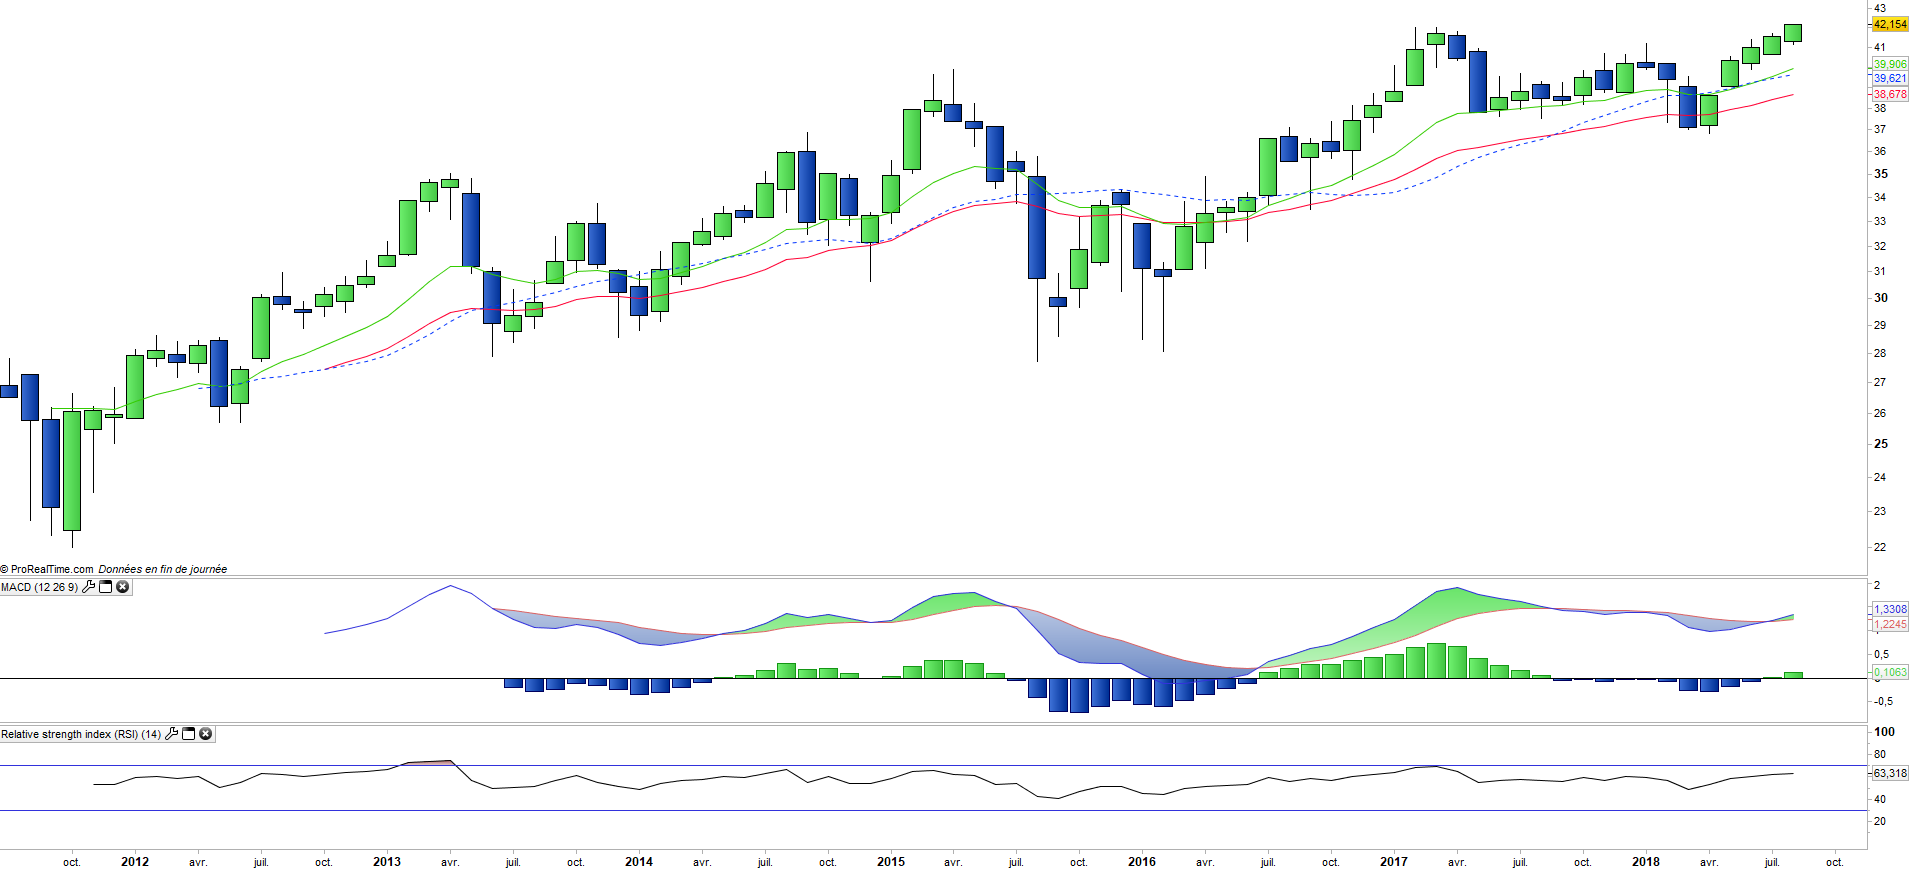
The monthly chart shows a well-established long-term trend, which has tended to strengthen over the last few months, which also reflects a good relative performance. Prices are setting new historical highs and the MACD has just crossed upward, pointing for an acceleration in the momentum.
Weekly data
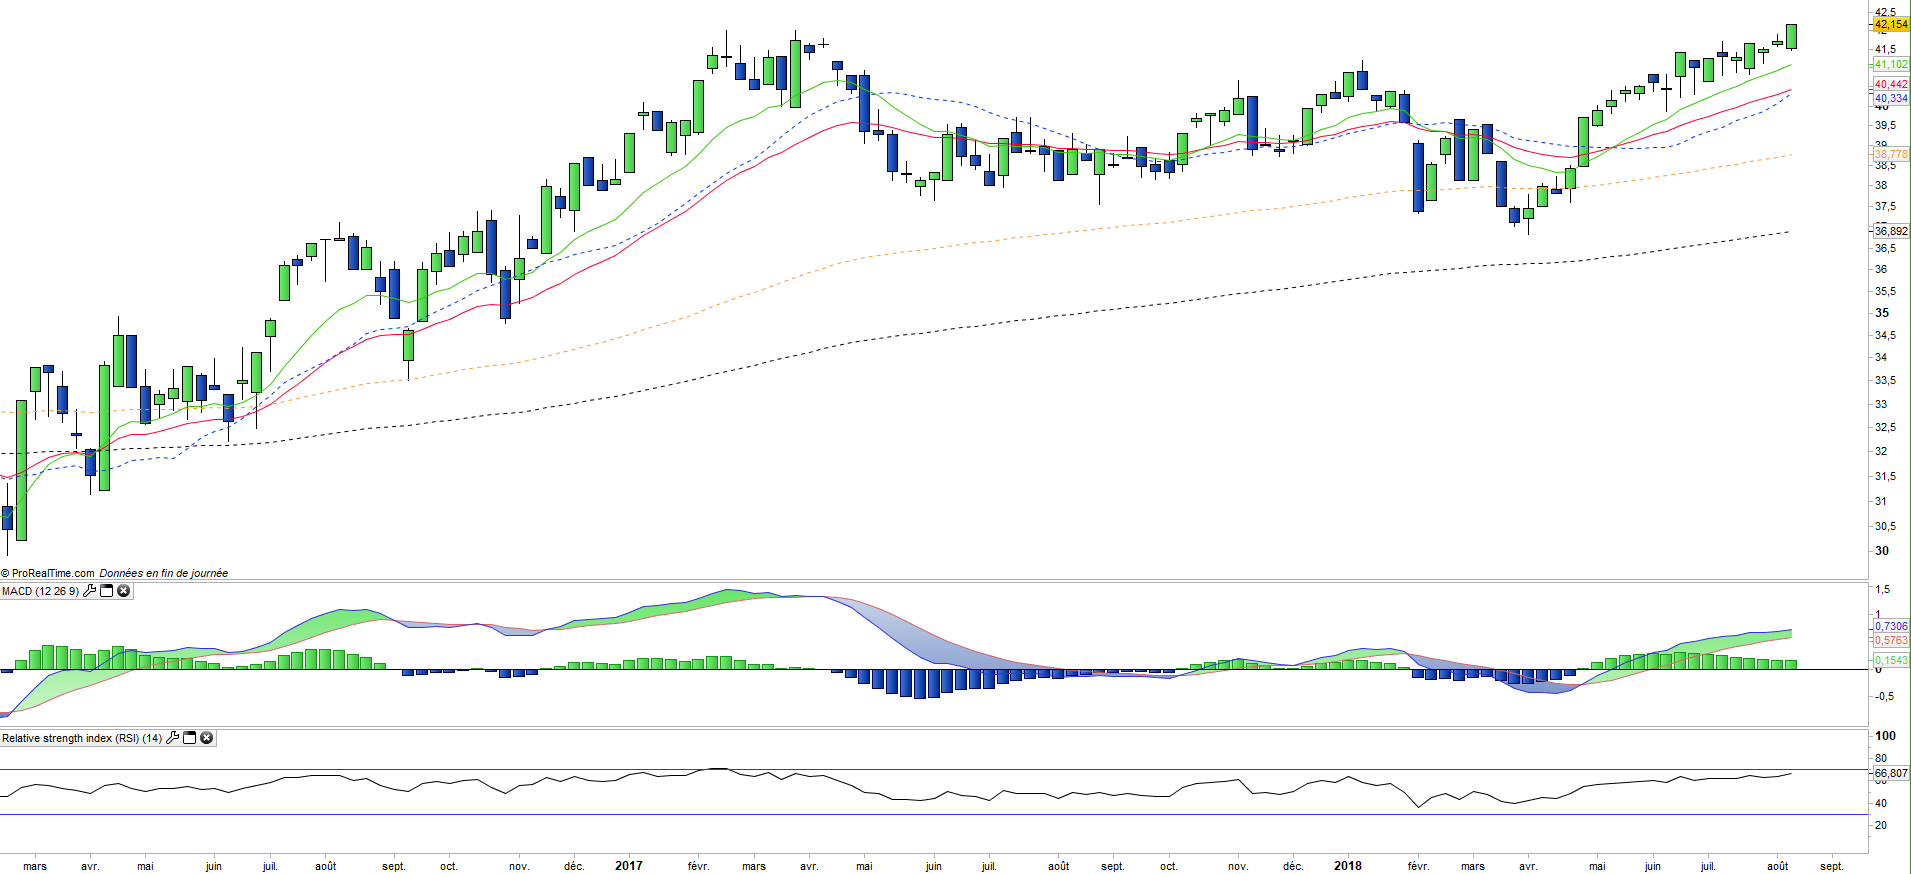
On the weekly chart, we can see the trend change that took place in May, which was signaled by the crossing of the EMAS13 and 26 as well as by the MACD which turned positive and has crossed the zero line upward. The trend is clearly bullish and is accelerating again with the crossing of the historic highs of 2017.
ETF Objective
AU2 is a UCITS ETF, listed in EUR, which seeks to replicate the S&P/ASX 200 Net Total Return index (200 australian companies)
Characteristics
| Inception date | 26/03/2010 |
| Expense ratio | 0,40% |
| Benchmark | S&P asx 200 |
| Issuer | Lyxor |
| Ticker | AU2 |
| ISIN | LU0496786905 |
| UCITS | Yes |
| EU-SD status | Out of scope |
| Currency | € |
| Exchange | Euronext Paris |
| Assets Under Management | 64 M€ |
| Replication Method | Indirect (swap) |
| Dividend | Distribution |
| PEA (France) | No |
| SRD (France) | Yes |
| Currency risk | Oui |
| Number of Holdings | 200 |
| Risk | 3/5 |
Country Breakdown
| Australia | 95% |
| United Kingdom | 2% |
| Others | 3% |
Sector Breakdown
| Financials | 35% |
| Materials | 18% |
| Consumer staples | 8% |
| Industrials | 7% |
| Real Estate | 6% |
| Energy | 6% |
| Others | 12% |
Top Ten Holdings
| Commonwealth Bank of Australia | 8% |
| Westpac Banking | 6% |
| BHP Billiton | 6% |
| Austr & NZ Banking Group | 5% |
| National Australia Bank | 5% |
| CSL Ltd | 5% |
| Westfarmers | 3% |
| Macquarie Group | 2% |
| Woolworths | 2% |
| Telstra Corp | 2% |