BRE is in an ETF which tracks the Index Basic resources of the Stoxx600 index which is a fairly narrow, composed of 20 major mining companies.
The 3 largest mining companies, Rio, BHP and Glencore Billington represent more than 50% of the weight of the Index and are listed in £ on the LSE. These are diversified mining companies (iron ore, copper, coal...) with market capitalizations between €50 and 75 bn €. These companies are listed on European market places (especially London) but the mines are often located in Africa, Australia or in the Americas.
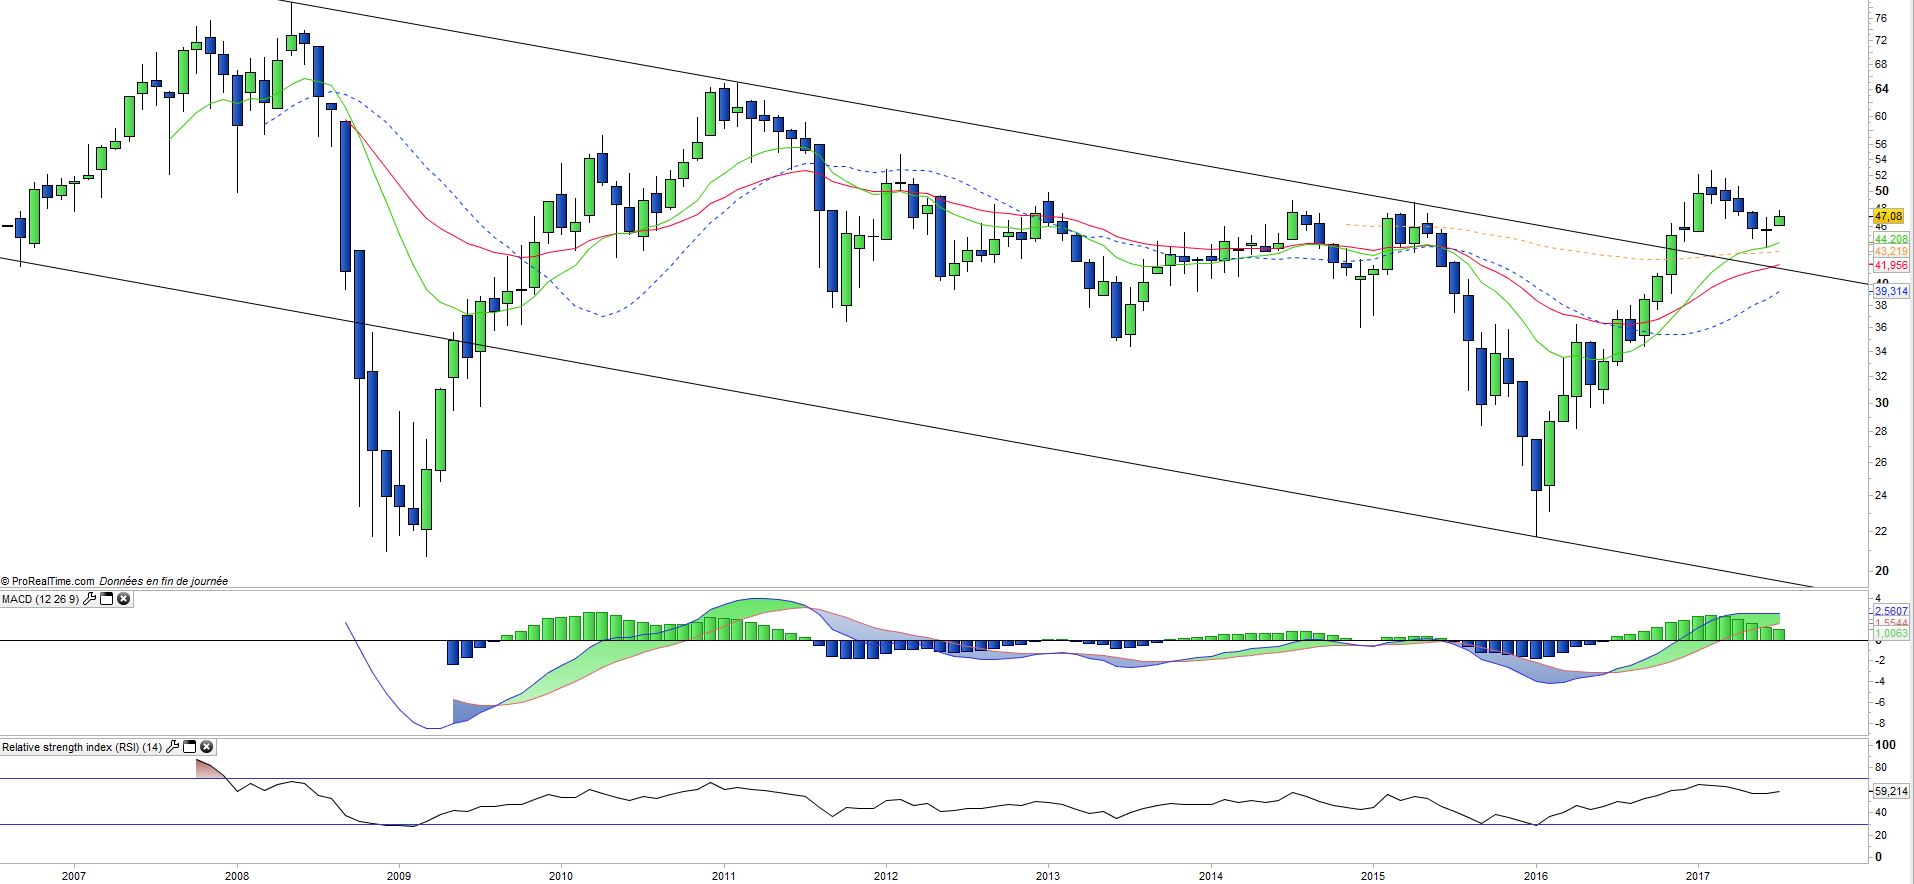
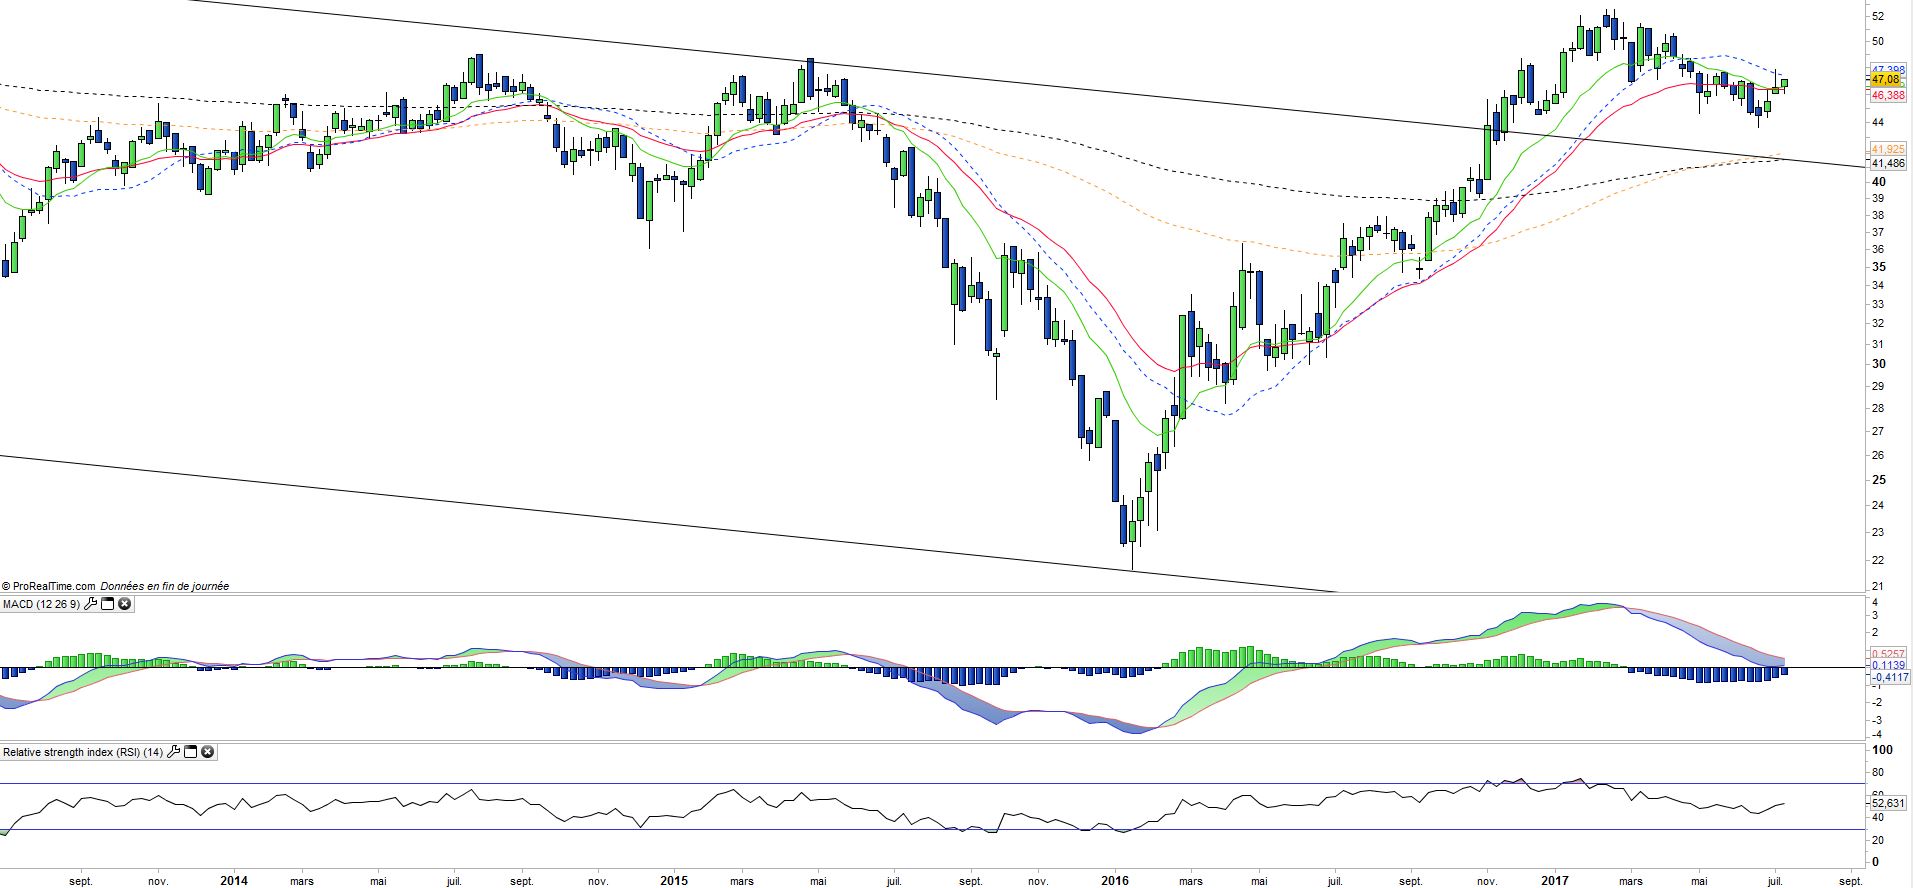
After some difficult years, commodity prices started to recover from the start of 2016, because of the reduction of capacity, (mainly in steel and aluminium) and optimism around Donald Trump's victory in the US presidential election, linked to the promise of a huge infrastructure programme, as main catalysts. However, price developments in 2016 major materials was fairly mixed and sometimes negative (aluminum, copper, etc.), with the exception of iron ore which rose significantly in the first few months of 2017, which is linked to Western anti-dumping measures impact on China. The current policy is keen to support China's economy (housing/construction in particular), in a specific political context (renewal of Mr XI by the communist party) and issued may therefore somewhat fragile.
Diversification is at the heart of the strategy of large mining companies wishing to rather developing capacity in the sectors of the future (Aluminum, copper, etc.) and the decrease in the sectors in difficulty (coal...). The sector depends on two major factors that are demand, in particular for infrastructure mainly from China and the US, but also major emerging markets such as India, but especially supply overhang so far. The scenario of a Chinese squeeze of capacity does not appear likely on the agenda, particularly in iron ore.
BRE is a very volatile support, which is highly sensitive to changes in demand but also adjustments to the offer. The 0.3% expenses are in the middle of our sample. Assets Under Management : 283 €M. After a drop of nearly 32% in 2015, BRE rose more than 64% in 2016 and 3% in 2017. The reflation theme of the global economy is positive for commodity and mining sectors, which explains the good recent performance.