Lyxor ETF Basic Resources - BRE - 25/07/2018
Short Term strategy: Negative (40%) / Trend +
Long Term strategy: Positive (90%) / Trend =
Characteristics of the ETF
The ETF Lyxor BRE (Basic Resources UCITS Europe) created in 08/2006 is listed in Euro on Euronext and seeks to replicate the index STOXX600 Basic Resources Europe composed of 22 European stocks of which about 2/3 are English, which implies a significant risk related to the Euro – Sterling evolution which can be quite volatile in this period of Brexit.
The costs of this ETF are 0.3% and the AUM of approximately 208M€. Replication is indirect (via Swap) and there is a dividend capitalization policy. This ETF is eligible for PEA.
Alternative ETFs: EXV6 (iShares in Euro)
Latest developments
BRE rose 22.3% in 2017, which is significantly higher than the Stoxx600NR (10.6%) and is linked to the rebound in commodities, which tended to stabilize in 2018.
Since the beginning of the year, the index is up 1.8% online with stoxx600NR. Commodity prices and mining sector behavior remain highly correlated with China, the world's largest consumer. The trade war with the US and the fall of the Yuan weighed in recent weeks on the index, however the latest fiscal stimulus measures announced by China - tax deduction of R & D expenses etc ... - are positive and should support the economy.
This news has caused a rebound in commodity prices and the mining sector.
Index & components
This is a fairly narrow index composed of 22 major mining companies, mostly listed in the UK.
The 3 largest mining companies, Rio Tinto, BHP Billington and Glencore account for c. 50% of the weighting of the index and are quoted in £ on the LSE. They are diversified mining companies (iron ore, copper, coal ...) with market capitalizations between € 50 and € 75bn. These companies are listed on European markets (especially London) but mining operations are most often located in Africa, Australia or the Americas.
After five difficult years (2011-2015), commodity prices started to recover in 2016, due to Chinese capacity reduction announcements (mainly steel and aluminum) and a surge of optimism around the world. Donald Trump's victory in the US presidential elections, tied to the promise of a major infrastructure program, as key triggers.
The prices evolution rather favorable in 2017 for a certain number of metals (aluminum, copper, Nickel, Palladium ...) because of a reduction of the overcapacities coming from China, and growth themes like the electric car and renewable energies. The current demand is also largely due to China's monetary support for its economy (real estate / construction in particular) and can therefore seem a bit fragile. Diversification is at the heart of the strategy of the major mining companies who wish rather to develop capacities in the sectors of the future (Aluminum, Copper ...) and to reduce them in troubled sectors (Coal ...).
The sector depends on two main factors, namely demand, especially for infrastructure and the industrial sector (construction and automotive), mainly from China and the US, but also from Europe and major emerging countries such as India, but especially of the supply side so far plethoric. The scenario of a drastic decline in Chinese capacity does not seem to be on the agenda, especially in iron ore, but the introduction of the US import tax on certain metals (aluminum) could incite China to more discipline on its supply policy. BRE remains a rather volatile medium, which is very sensitive to variations in demand but also to supply adjustments.
Monthly data
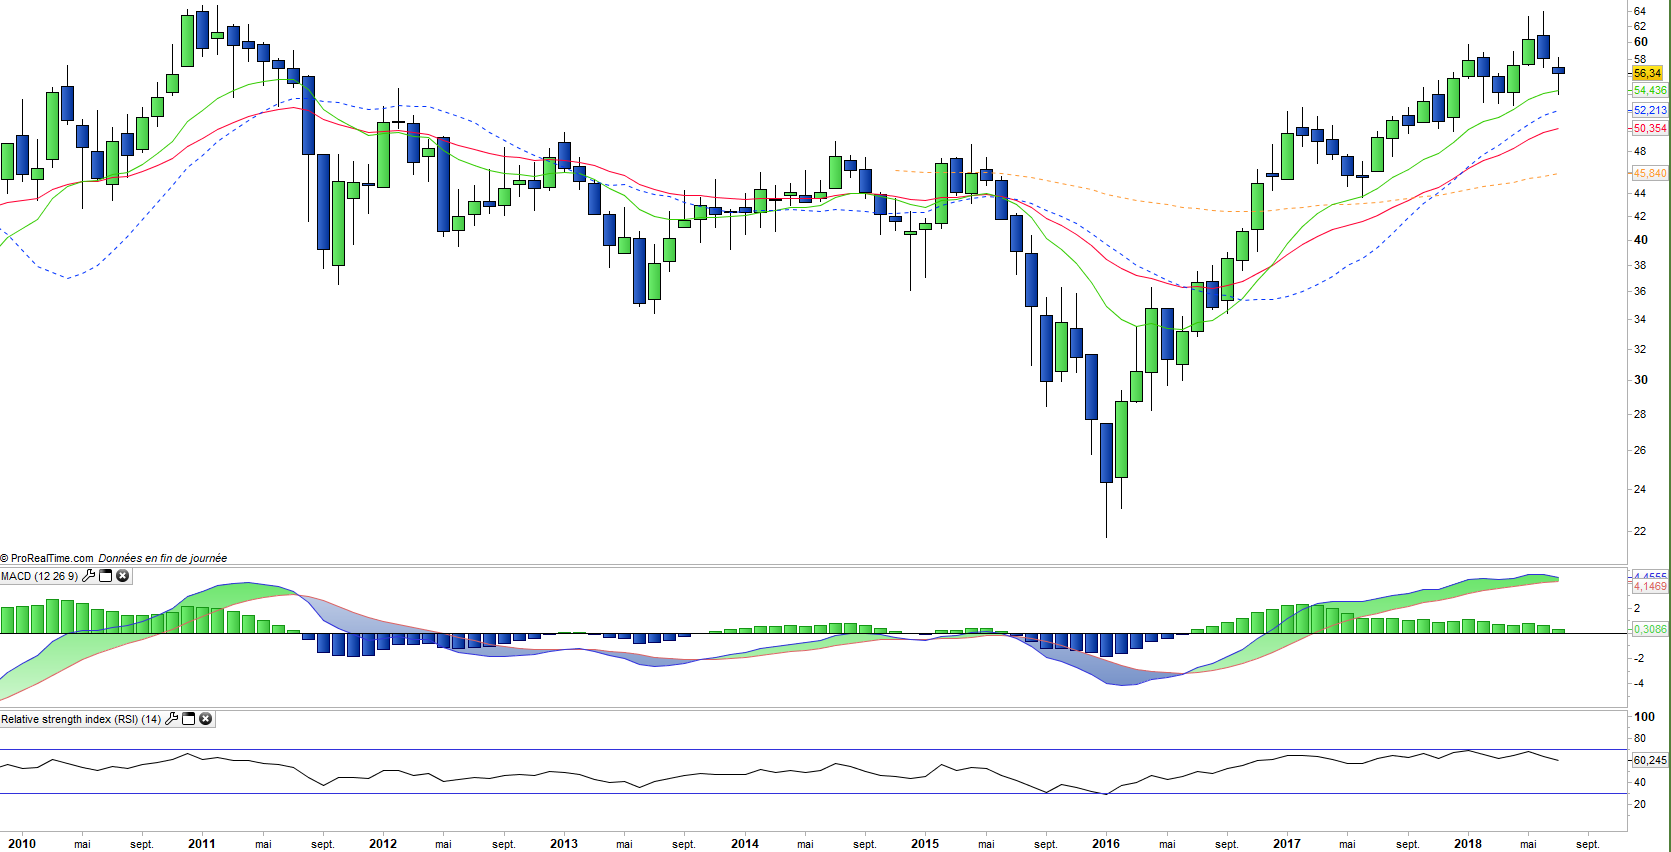
The monthly chart shows a bullish trend that marks a pause, which is clearly visible on the July candlestick that comes to rely on the EMA13. This candle is a doji that marks a stop in the corrective movement, which is rather positive for the future. The technical oscillators remain bullish which pleads for a continuation of the rise.
Weekly data
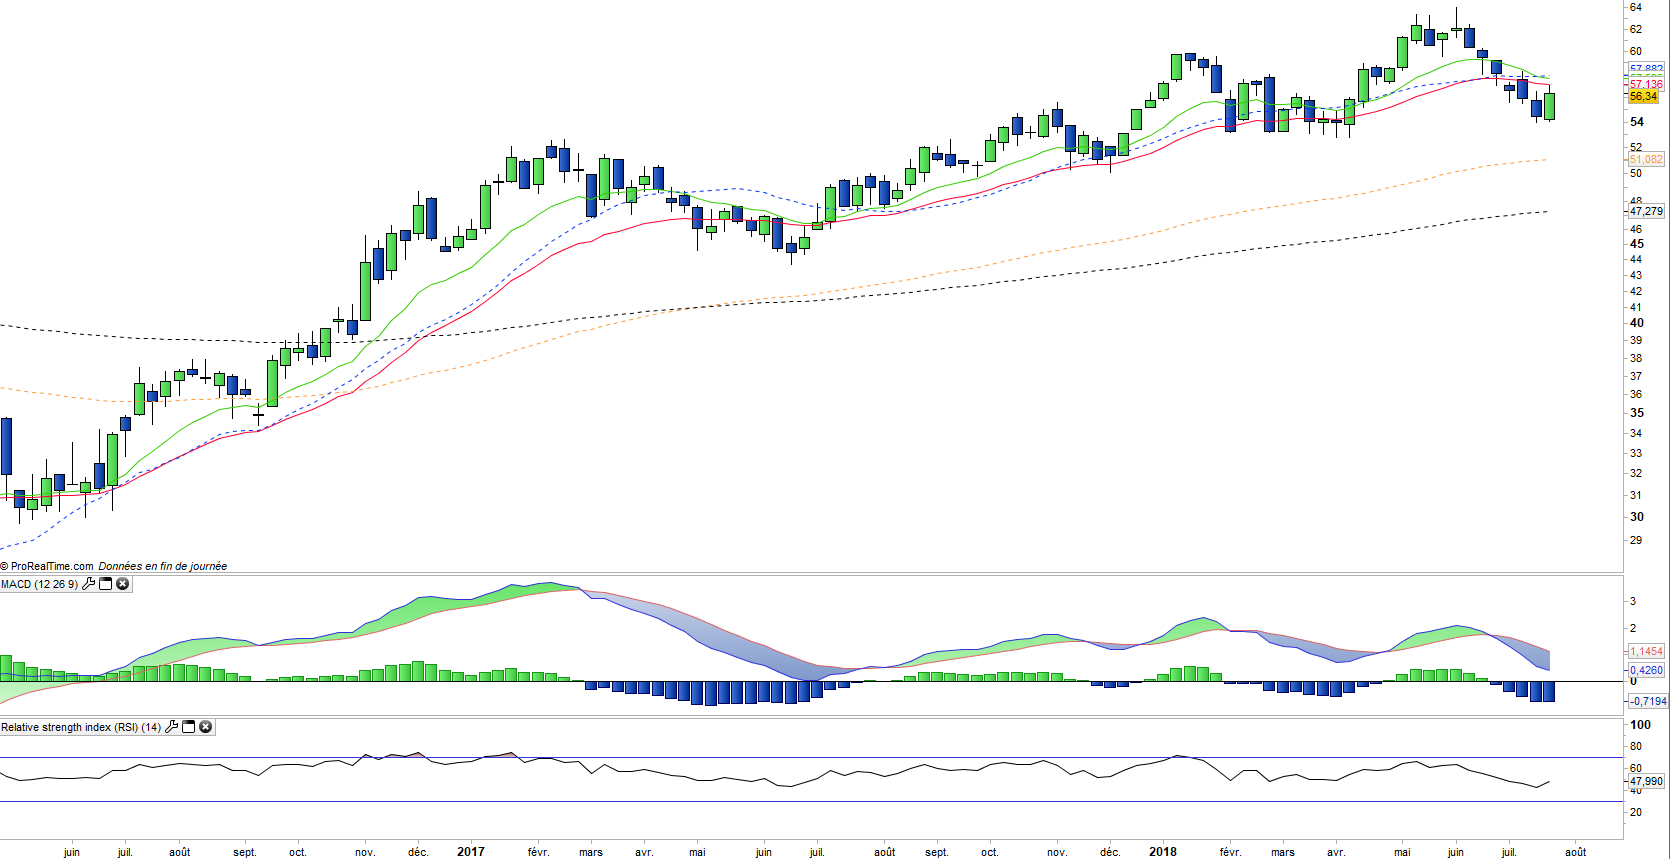
On the weekly chart, we can see that the uptrend is fairly regular but prices have crossed the EMA13 and 26 downward over the past two weeks. However the weekly candle in formation is a bullish engulfing which is a bullish pattern for the continuation of the rebound.
ETF Objective
BRE is a UCITS ETF, listed in EUR, which seeks to replicate the STOXX Europe 600 Basic Resources Net Return EUR index (22 european companies)
Characteristics
| Inception date | 25/08/2006 |
| Expense ratio | 0,3% |
| Benchmark | Stoxx600 Basic Resources Net Return |
| Issuer | Lyxor |
| Ticker | BRE |
| ISIN | FR0010345389 |
| UCITS | Yes |
| EU-SD Status | Out of scope |
| Currency | € |
| Exchange | Euronext |
| Assets Under Management | 208 M€ |
| Replication Method | Indirect (swap) |
| Dividend | Capitalization |
| PEA (France) | Yes |
| SRD (France) | Yes |
| Currency risk | Yes (£/€) |
| Number of Holdings | 22 |
| Risk | 4/5 |
Country Breakdown
| United Kingdom | 33% |
| Australia | 16% |
| Switzerland | 13% |
| Finland | 10% |
| Luxemburg | 10% |
| Sweden | 6% |
| Norway | 3% |
| Others | 9% |
Sector Breakdown
| Materials | 95% |
| Energy | 3% |
| Consumer staples | 2% |
Top Ten Holdings
| Rio Tinto | 22% |
| BHP Billiton | 16% |
| Glencore Xstrata | 13% |
| Anglo American | 7% |
| ArcelorMittal | 7% |
| UPM-Kymmene | 6% |
| Stora Enso | 4% |
| Mondi | 3% |
| Tenaris | 3% |
| Boliden | 3% |