The CAC ETF (Lyxor) replicates the CAC 40 index, which is composed of the 40 largest French securities representative of the main sectors of the french economy, while the securities are selected and weighted according to the size of their floating market capitalization.
The costs of the ETF CAC are quite low at 0.25% and the AUM is 4434M€. Replication is direct (physical) and there is a dividend distribution policy.
Alternative ETFs: C4D (Amundi in Euro), E40 (BNP in Euro)
Latest developments
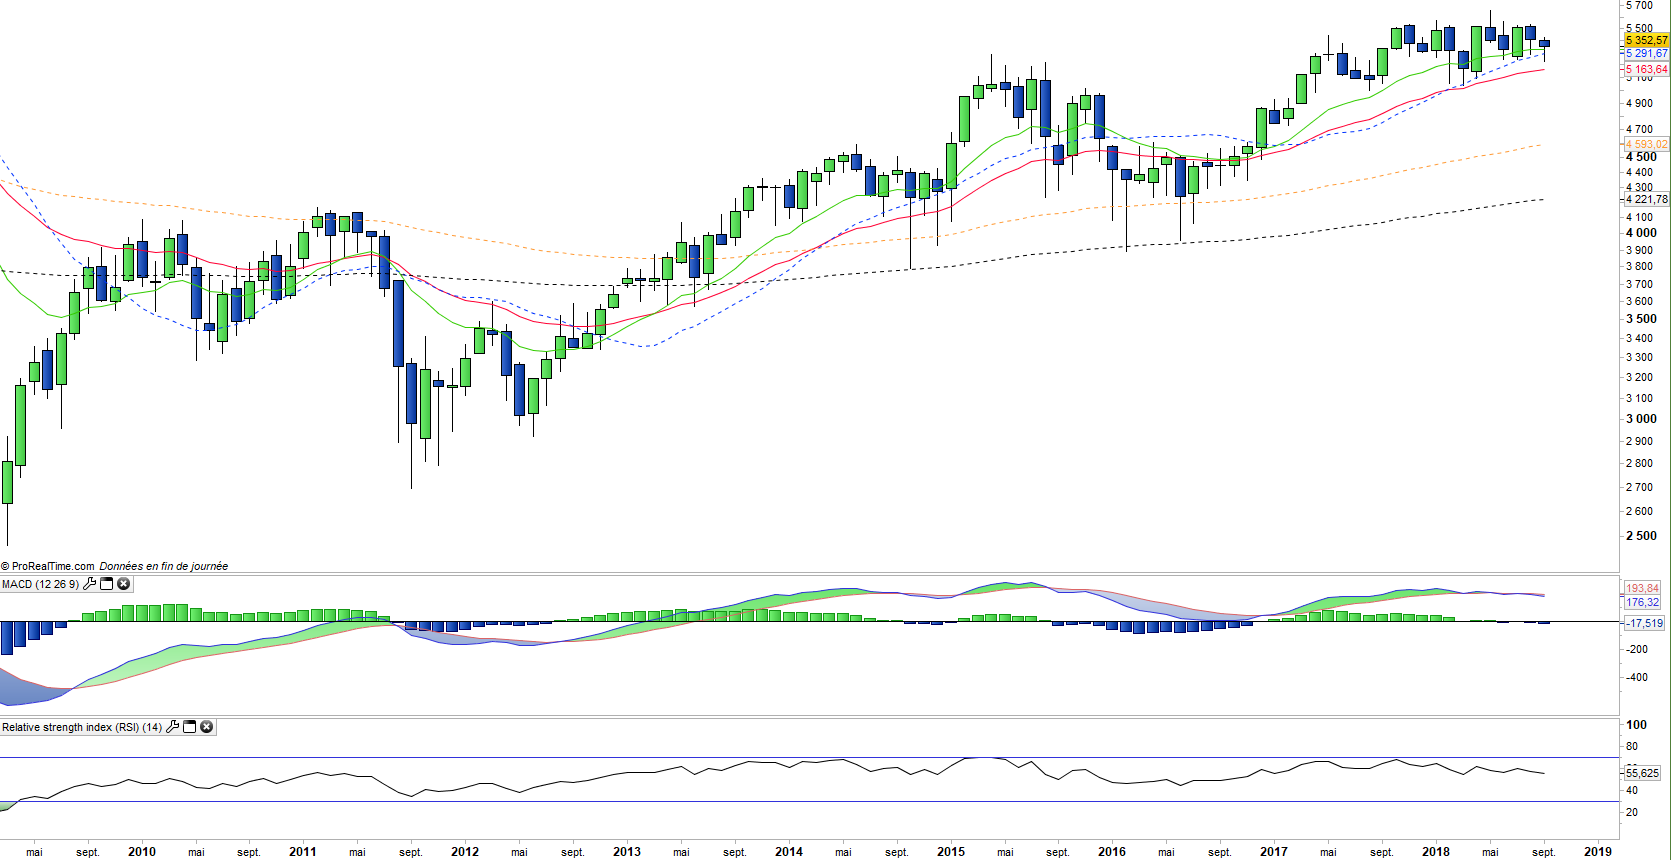
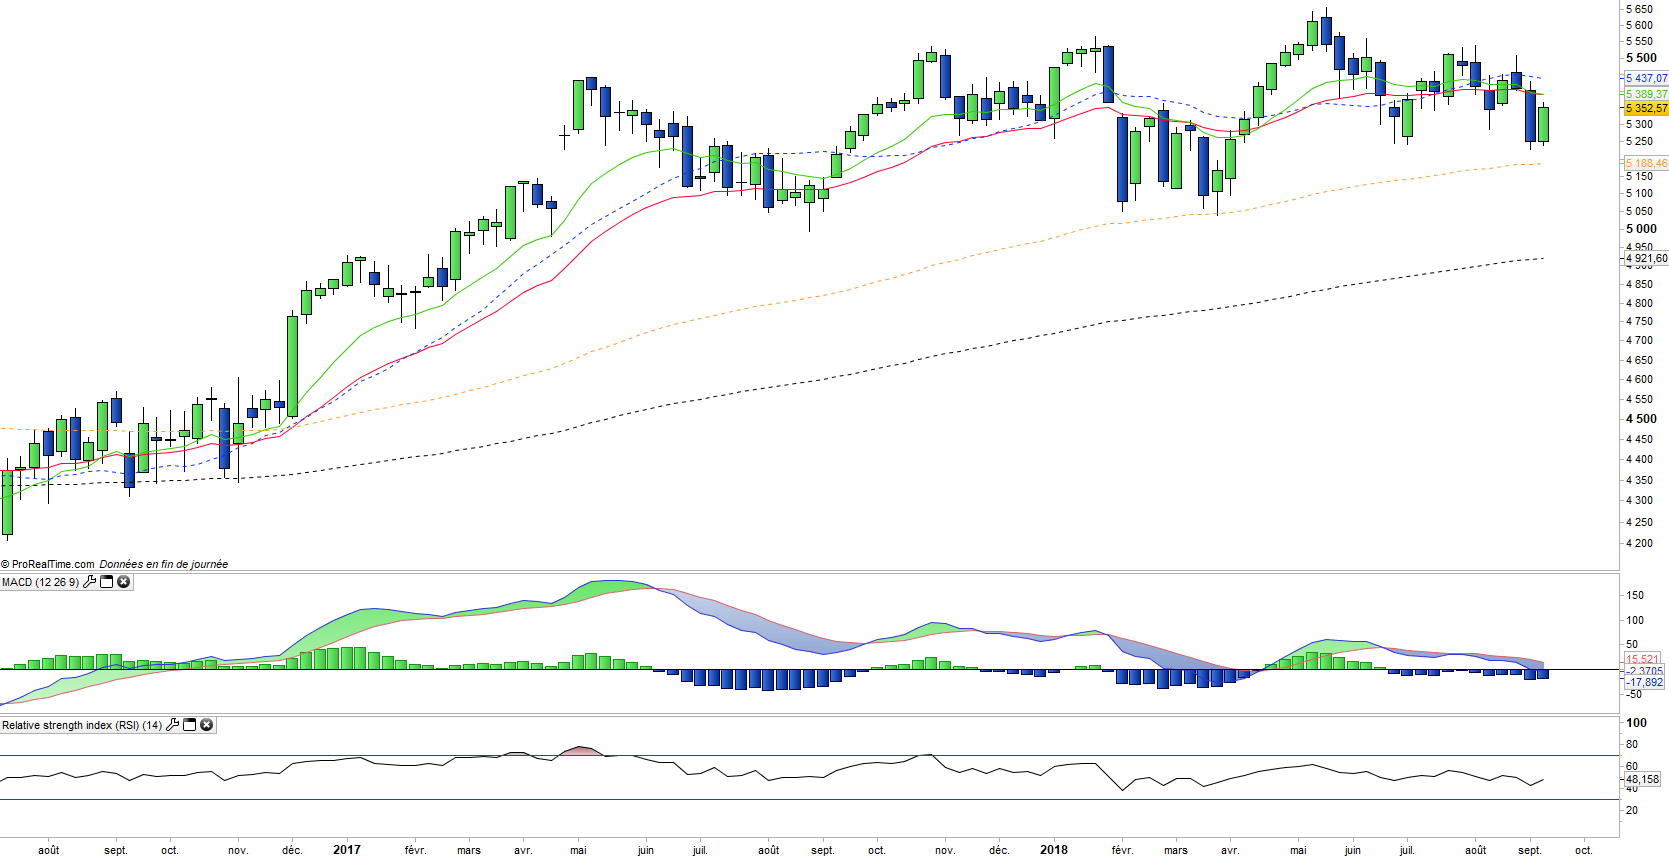
In 2017, the CAC40 achieved a performance of 9.3% and after a rather chaotic first part of the year is now slightly up 0.8% in 2018.
The dynamics of the CAC40 is supported by a few sectors ( Luxury, Technology and Petroleum) while cyclical stocks (cars, construction ...) are under pressure because of fears over the economic cycle, which is linked to global political factors (D.Trump and its trade war) and European (Italy, France, Brexit).
The cycle of corporate profit growth seems well established (+ 8% estimated in 2018) coupled with reasonable valuations (PER of 15x), which limits its bearish potential.
Index & components
It should be noted that the 10 main holdings (which represent about 55% of the index) belong to very different sectors, unlike the DAX (overweight in industrial stocks) or the FTSE100 (pharmacy and financials), the CAC40 is indeed more composite in its sectoral composition. However, three high-weighted stocks, Total (11%), LVMH (7.3%) and Sanofi (7%), can influence the index according to their own fundamental factors, which represents a bias.
From a sectoral point of view, we can see that the consumer goods sector represented by luxury goods and cosmetics such as LVMH or Loreal, is the most important for the index (20.3%), followed by industry (19.3%), financials (12%) and energy (12%).
The CAC40's stocks are often world leaders with a very international exposure, and little dependence on the domestic market and with a strong sensitivity to the US Dollar. French macroeconomic statistics have improved significantly since several months, but especially investors regained confidence with the election of Mr Macron, a liberal and pro-European. The risk premium linked to the disastrous catastrophe scenario in the euro zone began to decline as soon as the first poll results were released, but the positive impact on French growth linked to the election momentum and hopes for structural reforms as well as the lowering of corporate and capital taxes confirmed for the 2018 budget are still far from being fully integrated.
France is at the beginning of a new cycle and strong, positive trends could start this time. The medium-term potential of the index is high, as the corporate earnings momentum now seems to have really kicked in after several false starts since 2012 - earnings growth is estimated at around 15% in 2017 and 8% in 2018.
Financials should be key, as they could benefit from the gradual rise in long-term rates as growth resumes and higher inflation expectations, as is already the case in the US, coupled with a more favorable political context.