Lyxor CAC 40 (CAC) - 28/08/2017
Short term strategy : Negative (10%) / Trend -
Long term strategy : Positive (90%) / Trend -
Characteristics of the ETF
The tracker CAC (Lyxor) seeks to replicates the CAC 40 index (dividend reinvested), which is constitued with the 40 largest French companies representing the main sectors, namely selected by the importance of their market capitalisation.
The top 10 holdings are very different animals: unlike the DAX (overweight in industrials) or the FTSE100 (pharmaceuticals and financials), the CAC40 is indeed more composite in its sector composition. However two heavyweights, Total and Sanofi (18% for the index) may impact the index depending on specific underlying fundamentals factors, which may represents a bias.
Sector-wise speaking, we see that the consumer goods sector, mainly represented by the luxury and cosmetics stocks like LVMH and L'Oréal, is the most important for the Index ahead the industry, financials and energy.
The ETF CAC expenses are quite low at 0.25%. The fund size is very significant, at 4 450 M€.
In 2016, the CAC40 posted a performance of 4.9%, and + 5% since the beginning of the year 2017 but it is still very far from its 2007 levels (6,168 points) or 2000 (6,945 points), and is lagging behind the US, English or German indexes. It is, however fair to relativise this lag because the CAC40 benchmark is ex-dividend while the DAX e.g., includes dividends, which deprives it of 3% growth per annum.
Macroeconomic figures are improving, but especially the French poll comes to eliminate a major risk with the election of Emmanuel Macron, a liberal and a pro-European. The risk premium related to the worst-case scenario of dislocation in the euro area has started to decrease from the results of the first round, but the potential positive impact on GDP growth link to the dynamics of the election, hopes of structural reforms and tax reduction on both corporates companies and capital are still far from being integrated.France looks possibly at the beginning of the cycle, and a positive mega-trends may this time activated.
The mid-term potential of the index is significant, provided that the momentum on profits was actually initiated after many false starts since 2012 that seemed to be confirmed with the H1 2017 strong figures. Financials performance should be key, as they should benefit later on from the likely rise in long interest rates, along with the recovery in growth and inflation’s expectations) and a more favourable political environment. Furthermore many cyclicals offer some significant potential for EPS growth after a relatively weak 2016’s performance, especially in financials and construction sectors. Expectations of earnings growth for the CAC40 are approximately + 15% in 2017.
However, the short-term momentum is now curbed by the euro's rise, which is approaching the threshold of 1.20 and is becoming problematic for some sectors (technology, aeronautics, etc.), but the potential for a further rise in the euro appears more limited in the medium term due to a likely very gradual hike in rates and a structural growth potential that remains lower than that of the US. Moreover, the Italian elections which will have taken place by spring 2018 could weigh on the European currency and sovereign rates.
In the shorter term, the return of geopolitical fears and the threat of a US government shutdown could weigh on the markets.
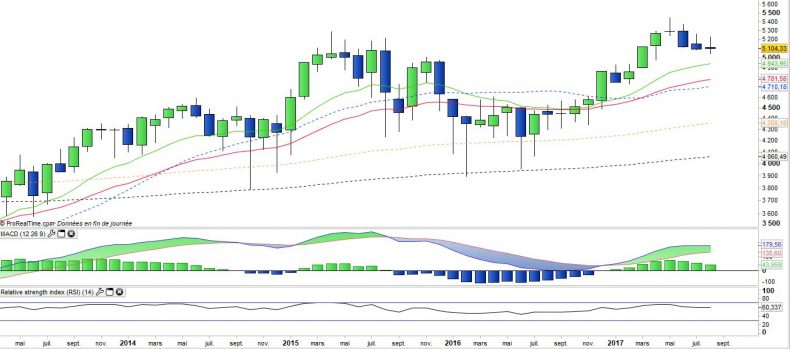
Monthly data
The analysis of the monthly charts shows a long-term trend which remains positive, but which is in the correction phase for 4 months after the peak of May. This correction appears to be loosing momentum judging by the monthly candlestick (doji) in progress in August, while prices are also approaching the EMA13 at about 4950 pts.
The month of September could possibly mark the end of the correction by going to bounce on the zone of support.
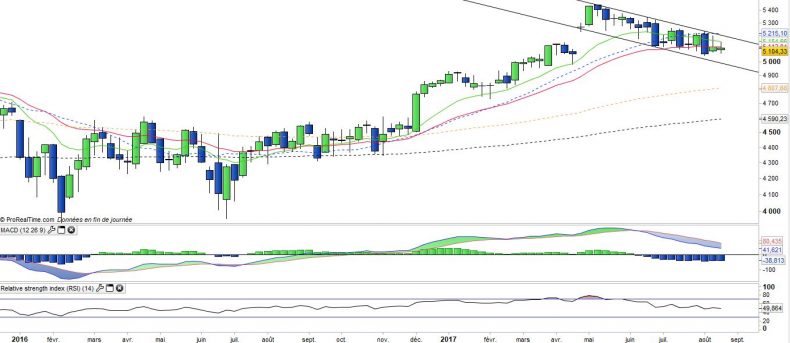
Weekly data
The weekly chart shows a short-term bearish channel of low amplitude. The way of exit of this trading range should determine the trend of the weeks to come. In the event of a negative breakout of the channel in a renewed volatility, the correction could deepen to the area of 4800 pts (M100E).
For the moment volatility remains low and the resistance line is at around 5170pts, uncertainty dominates in the short term on the direction of exit but the narrow structure of the channel also implies that it can have only a limited time.
ETF Objective
CAC is a UCITS compliant ETF that aims to track the benchmark index CAC 40 Gross Total Return
Characteristics
| Inception date | 13/12/2000 |
| Expenses | 0,25% |
| Issuer | Lyxor |
| Benchmark | CAC 40 index (PX1) |
| code/ticker | CAC |
| ISIN | FR0007052782 |
| UCITS | Yes |
| EU-SD status | Out of the scope |
| Currency | EUR |
| Exchange | Euronext Paris |
| Assets Under Management | 4 220 M€ |
| Replication method | Direct (Physical) |
| PEA (France) | Yes |
| SRD (France) | Yes |
| Dividend | Distribution |
| Currency risk | No |
| Number of Holdings | 40 |
| Risk | 3/5 |
Country Breakdown
| France | 92% |
| Finland | 3% |
| Switzerland | 2% |
| Luxembourg | 1% |
| United Kingdom | 1% |
| Belgium | 1% |
Sector Breakdown
| Consumer Discretionary | 18% |
| Industrials | 17% |
| Financials | 15% |
| Consumer Staples | 11% |
| Health Care | 10% |
| Energy | 9% |
| Materials | 8% |
| Others | 12% |
Top Ten Holdings
| Total SA | 9% |
| Sanofi | 8% |
| BNP Paribas | 6% |
| LVMH | 5% |
| AXA | 4% |
| L'Oréal | 4% |
| Air Liquide | 4% |
| Airbus | 4% |
| Vinci | 4% |
| Danone | 3% |


