Amundi ETF China (CC1) - 13/06/2018
Short Term strategy: Positive (80%) / Trend =
Long Term strategy: Positive (100%) / Trend =
Characteristics of the ETF
The CC1 ETF (Amundi) created in 03/2009 is listed in EURO on Euronext and replicates the MSCI China-H net dividends reinvested index ("net return"), which is composed of the main Chinese stocks listed in Hong Kong and composed for 2/3 of financial values. These shares are subject to Chinese regulation but denominated in Hong Kong dollar (HKD). Chinese H shares, unlike A shares, are available to non-resident investors in China. The target for maximum tracking error between changes in the net asset value of the Fund and that of the MSCI China H Index is 2%. This tracker presents a currency risk linked to the exposure of the MSCI China H Index, resulting from the evolution of the reference currency, the Hong Kong dollar (HKD).
The fee of this ETF is 0.55% for an AUM of 91M €. The replication method is synthetic (via swaps).
Alternative ETFs: CSIA (Lyxor in Euro), FXI (iShares in USD)
Latest developments
After a rise of 13.6% in 2017, CC1 still shows an increase of 5.3% in 2018 despite the correction of the beginning of the year, coming from America.
China's growth is supporting the index, in a qualitative way as it is increasingly focused on services and technology rather than production. China, however, is impacted by fears of trade war with the US, while Trump is stepping up protectionist measures, most recently on aluminum and steel and perhaps soon on the automotive industry. The Chinese surplus is a very strong irritant for the US president, but trade talks are under way and could bear fruit if China opens up in certain market segments.
Strong global growth benefits the Chinese economy, which relies heavily on exports to the West, including electronics and manufactured goods.
Index & components
The equities that make up the MSCI China-H Index come from the universe of the most important stocks in the Chinese market.
The MSCI China-H Index is composed of 68 constituents, so it is relatively diversified. The financial sector (banks and insurance companies), however, accounts for about 68% of the capitalization while the China Construction Bank accounts for 16% of the index.
China is the world's second largest economy behind the US with a GDP of about $ 13600bn in 2017, the world's largest exporter with the world's largest foreign exchange reserves. The global recession of 2009 interrupted China's continued growth momentum, and the limits of its export-oriented growth model emerged. As a result of the global economic downturn and declining trade, Chinese growth decelerated to below 7% in 2015, its lowest level in 25 years. However, in 2017, growth reached 6.9% of GDP, an improvement over 2016 (6.7%). State-owned enterprise debt accounts for 145% of GDP while private sector debt accounts for more than 200% of GDP. In addition, the quality of bank assets has deteriorated for several years and this trend is probably underestimated because of the importance of the shadow banking. Many challenges remain linked to the problem of an aging population, the lack of openness of the political system, the competitiveness of an economy dependent on high investment expenditure and the expansion of credit. The manufacturing and construction sectors contribute nearly half of China's GDP, but the country is increasingly relying on services and domestic consumption.
China has set a new growth target for 2018 of around 6.5%, which means a gradual soft landing linked to the new growth model, more based on quality, corresponding to an upscaling of industry and services, but also focused on reducing the current major imbalances (too high debt, overcapacity in industry and real estate). China no longer seems to be in the race for growth, but in search of a more balanced and sustainable model based on the upscaling of its industry through technology and the expansion of services and domestic consumption.
China faces geopolitical problems with most of its neighbors (India, Japan ...) and especially in the China Sea, because of its plans for territorial expansion that could lead to military confrontations. Its confrontation with the USA, at the commercial level, could be amplified under the background of the Korean crisis.
Monthly data

The analysis of the monthly charts shows that the index is in a long-term positive trend well installed since the summer of 2016. The pace is progressive with sometimes peaks of volatility as it was the case in February 2018. The oscillators are positive, and moving averages going upward arguing for a continuation of the trend, with a first goal towards the peak of the beginning of the year at around 300 €.
Weekly data
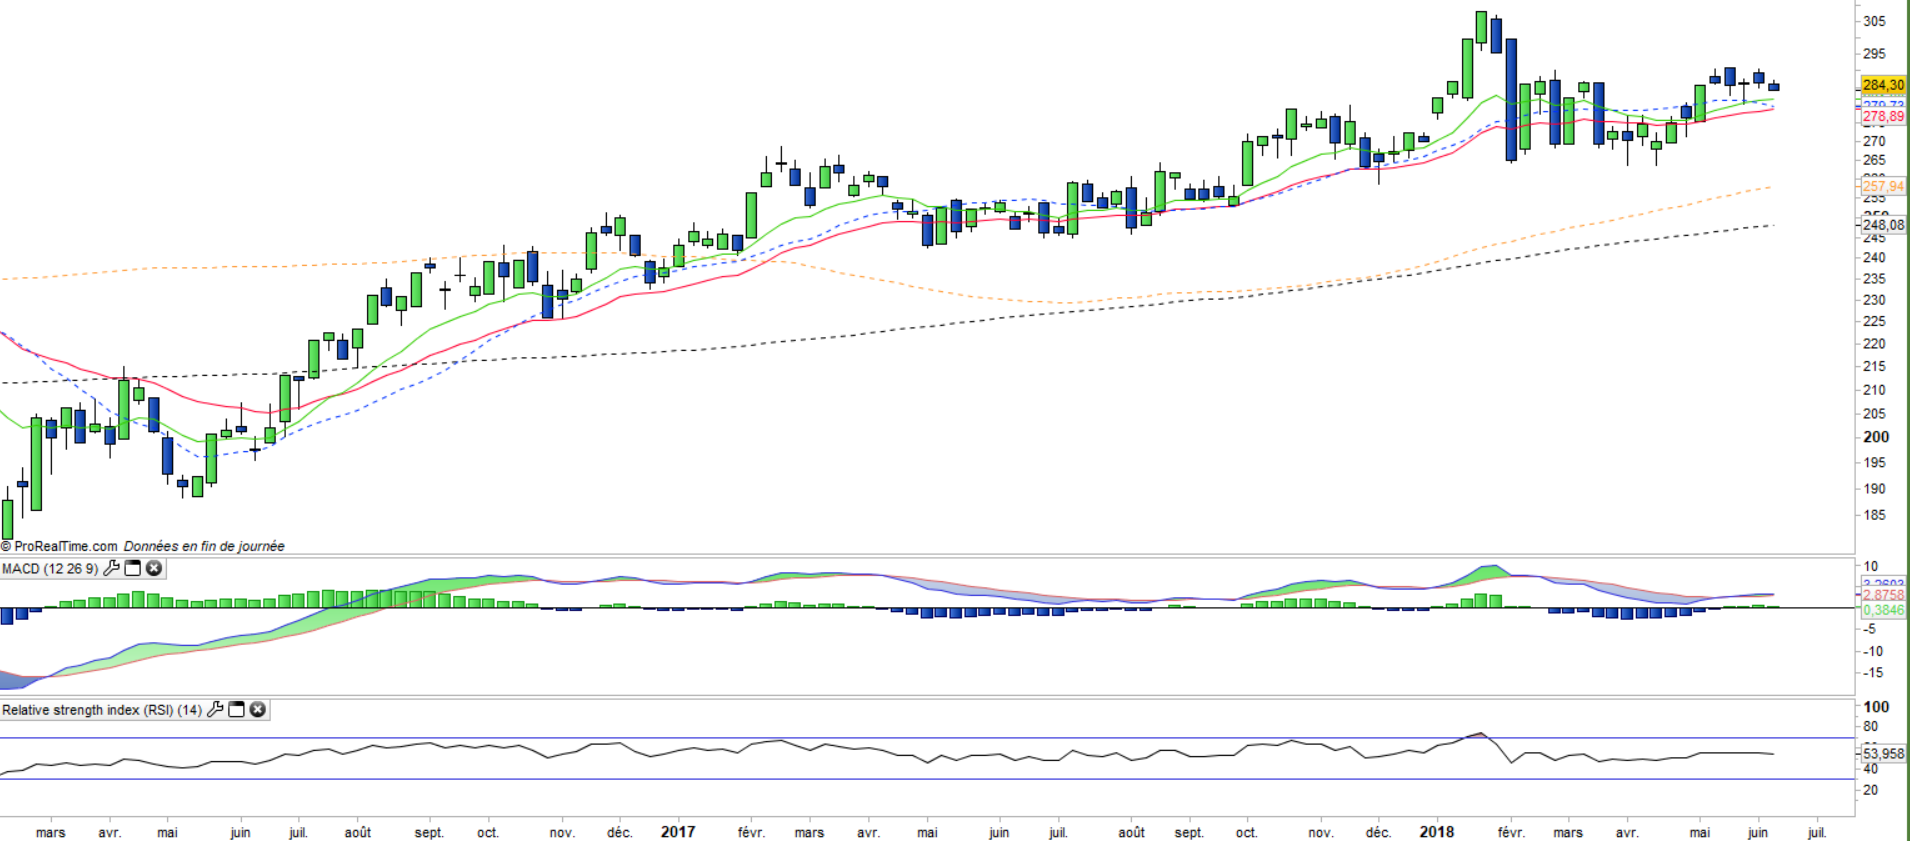
The analysis of the weekly charts shows a positive trend in the medium term but whose dynamics are irregular without being very volatile, besides the EMA13 and 26 remain crossed upward since July 2016. The positive crossing of the MACD occurred in late May is a positive factor for the future, and the other oscillators are also well oriented which argues for the continuation of the uptrend.
ETF Objective
CC1 is a UCITS ETF listed in €, which seeks to replicate the MSCI China H index (68 chinese companies)
Characteristics
| Inception date | 03/03/2009 |
| Expense ratio | 0,55% |
| Issuer | Amundi |
| Benchmark |
MSCI China H
|
| Code/Ticker | CC1 |
| ISIN | FR0010713784 |
| UCITS | Yes |
| EU-SD status | Out of scope |
| Currency | Euro |
| Exchange | Euronext Paris |
| Assets Under Management | 92 M€ |
| PEA (France) | Yes |
| SRD (France) | Yes |
| Currency risk | Yes |
| Number of Holdings | 68 |
| Risk | 4/5 |
Country Breakdown
| China | 100% |
Sector Breakdown
| Financials | 68% |
| Energy | 10% |
| Industrials | 6% |
| Materials | 4% |
| Consumer discretionary | 3% |
| Utilities | 2% |
| Health Care | 2% |
| Others | 5% |
Top Ten Holdings
| China Construct Bank | 16% |
| ICBC | 12% |
| Ping an Assurance | 10% |
| Bank of China | 8% |
| China Life Insurance | 4% |
| China Petroleum Chem | 4% |
| Petrochina Co | 3% |
| Agricult BK China | 3% |
| China Merchants Bk | 3% |
| China Pacific Insur | 2% |