Lyxor ETF stoxx 600 Commodities (CRB) - 04/01/2018
Short Term strategy : Positive (100%) / Trend +
Long Term strategy : Neutral (50%) / Trend +
Characteristics of the ETF
The Lyxor CRB ETF (Commodities) created in 01/2006 is listed in Euro on Euronext and seeks to replicate the performance of the Thomson Reuters / Core Commodity CRB Total Return benchmark index of 19 commodities listed in USD. It is an index of commodities futures calculated and published by Thomson Reuters.
There is a risk linked to the Euro - USD exchange rate in the event of a decline in the dollar.
The costs of this ETF are 0.35% and the AUM approximately € 916M. Replication is indirect (via Swap) and there is a policy of capitalization of interests.
Alternative ETFs: EXXY (iShares in Euro), GSG (iShares in USD)
Index & components
The CRB ETF is composed of a basket of 19 different raw materials, ranging from oil to corn, gold and copper.
These commodities are essentially traded in US markets, with a reference price in USD. This ETF therefore carries a currency risk, in the event of a significant variation on the € / $ parity, ie a potential strong depreciation of the dollar against the Euro, which does not seem to be the case even if the period is that of some catching up of the Euro linked to the restart of the economy of the zone.
On the other hand, it should be noted that energy accounts for nearly 40% of the index, of which just under 25% for WTI (23%), which has now returned above $ 60 due to the build up of a geopolitical premium (Iran, Venezuela ...). Oil is therefore important for the evolution of the index but does not explain the full performance of it. What is interesting to note in this index is the decorrelation between its components: the base metals (copper, nickel, aluminum ...) are linked to the growth of emerging countries, China in first place while the price of agricultural products can be influenced by the weather or other factors that may impact the output (wars, health problems, parasites ...).
Most of the commodities that make up the index are at a relatively low level, for very different reasons but this will not necessarily continue in the medium term. In addition, the technology could have a long-term structural negative impact on the prices of certain raw materials (electric cars on petroleum, transgenic agricultural products, etc.) and positive on others, such as copper and nickel. Sales pressures occur on a number of agricultural commodities that suffer from structural overcapacity.
The metals & mining sector has been buoyant for several months, and appears to be in a phase of expansion due to sustained global demand and some capacity adjustments from China.
Latest developments
After a rise of 13.4% in 2016 linked to the rebound of oil, CRB was down 11.6% in 2017, which is mainly due to agricultural raw materials which remain under pressure due to significant overcapacity (Corn, Wheat, Soy, Sugar ...).
However, over the last six months, the index is benefiting from a sharp rebound in WTI oil, which has climbed above $ 60 thanks to the extension of OPEC agreements on production cuts until the end of 2018 as well as the return of the geopolitical premium (riots in Iran, probable fall of Venezuela, tensions in Saudi Arabia). But also strong growth in metals such as copper or aluminum, which benefit from a very strong global demand, favorable long-term intrinsic trends compared to other metals and some control of China supply, in the wake of US retaliatory measures (aluminum). In terms of agricultural raw materials, the end of the year was favorable for cotton, which is once again bullish thanks to sustained demand and production that is finally lower than expected.
Cereals remain in sharp downtrend, but prices are at historically low levels, which should mechanically lead to a downward adjustment in production.
Monthly data
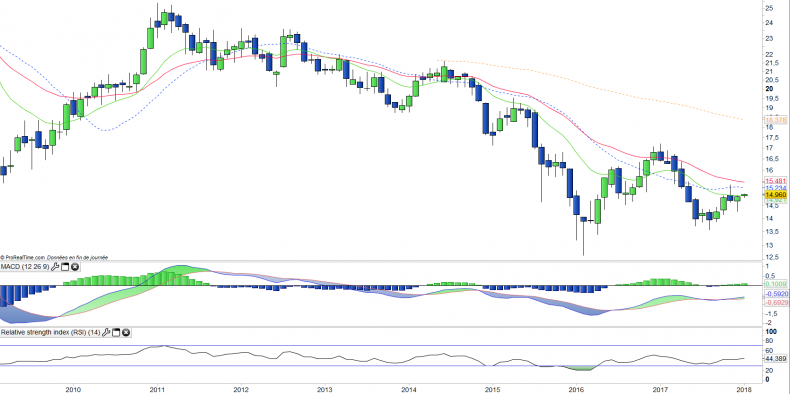
The monthly chart shows a long-term trend that remains bearish for now. Only the MACD has recovered, but still remains below its zero line. This decline shows visible signs of weakness, such as the flattening of moving averages and the inability of prices to form new lows. The current rebound is likely to form a double-bottom pattern.
This remains to be validated by the upward breakoutof the neck line located at 17 €.
Weekly data
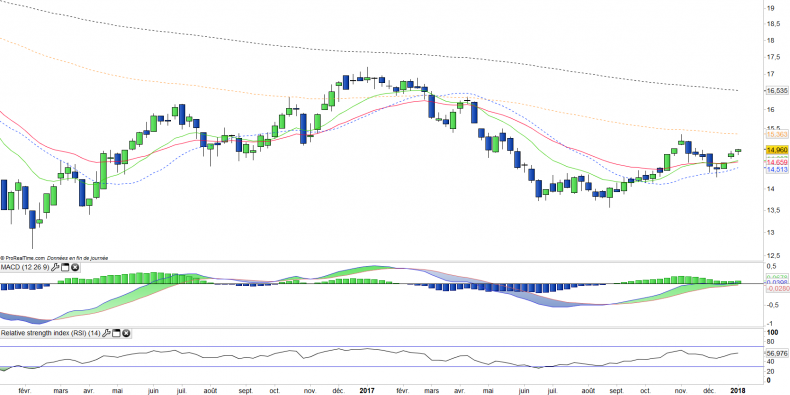
On the weekly chart, we can see that the trend is becoming bullish over the medium term horizon. The 13 E / 26 E moving averages are on the rise, the MACD is breaking up the zero line and the long term moving averages attack is now taking place, with the EMA100 as the first target, then the EMA200. The crossing of these moving averages would validate the return to an uptrend.
ETF Objective
CRB is a UCITS ETF which replicates the Thomson Reuters/Jeffries CRB index (diversified investment in commodities)
Characteristics
| Inception date | 26/01/2006 |
| Expense ratio | 0,35% |
| Issuer | Lyxor |
| Benchmark | CRB T-Reuters index |
| Code / Ticker | CRB |
| ISIN | FR0010346205 |
| UCITS | Yes |
| EU-SD status | Out of scope |
| Currency | Euro |
| Exchange | Euronext Paris |
| Assets Under Management | 915 M€ |
| PEA | No |
| SRD | Yes |
| Currency risk | No |
| Number of Holdings | 19 |
| Global Risk | 4/5 |
Country Breakdown
NS
Sector Breakdown
| Agricultural commodities | 41% |
| Energy | 39% |
| Base Metal | 14% |
| Precious Metal | 7% |
Top Ten Holdings
| WTI CRUDE FUTURE Feb18 | 23% |
| NATURAL GAS FUTR Feb18 | 6% |
| COPPER FUTURE Mar18 | 6% |
| SOYBEAN FUTURE Mar188 | 6% |
| GOLD 100 OZ FUTR Feb18 | 6% |
| LIVE CATTLE FUTR Feb18 | 6% |
| CORN FUTURE Mar18 | 6% |
| LME PRI ALUM FUTR Mar18 | 6% |
| COTTON N°2 FUTR Mar18 | 5% |
| SUGAR #11 (WORLD) Mar18 | 5% |


