Swiss Market index (CSSMI) - 10/05/2018
Short Term strategy: Negative (40%) / Trend +
Long Term strategy: Neutral (50%) / Trend +
Characteristics of the ETF
The CSSMI ETF (iShares) created in 10/1999, quoted in CHF (Swiss franc) on the Swiss market and replicated the Swiss Market Index (SMI) composed of the 20 main Swiss securities, large market capitalizations but whose weighting cannot exceed 18% of the index.
ETF fees are 0.35% while AUM amount to CHF 2110m. The replication method is direct (physical) and there is a dividend distribution policy.
Alternative ETFs: SMICHA (UBS in CHF)
Index & components
CSSMI replicates a relatively narrow index, the SMI consisting of only 20 values.
All these stocks are giants, world leaders like Nestlé the leader in Food business the first capitalization of the index (18%), followed by Novartis (17.7% of the index) and Roche (16.7%) the two pharmaceutical giants. These 3 stocks therefore represent half of the index and have a cumulated market capitalization of around 600MdCHF. The remaining 17 are the other half and consist mainly of financials (UBS, Credit Suisse, Zwiss Ré ...) and industrials (ABB, LafargeHolcim, Swatch ...).
This index has clearly defensive characteristics because of the 3 large weightings that belong to non-cyclical sectors, which acts as a buffer during cyclical recessions and downturns.
Switzerland is a small country of 8.4 million people but its economy is among the most prosperous and most developed in the world. Oriented to services, such as banking and insurance, as well as precision mechanics, the country produces mainly high value-added goods. The standard of living is one of the highest in the world. In addition, its stability and neutrality have attracted many foreign capital and international organizations such as the United Nations. Switzerland's GDP reaches $ 684bn in 2017 and is ranked 20th in the world at the same level as Saudi Arabia, while the Swiss franc is still considered a safe haven.
Investing in the Swiss index therefore presents the opportunity to both invest in large international stocks listed in Swiss francs, which represents a certain relative security in times of turbulence.
Latest developments
The performance of the SMI was + 14.1% in 2017 (against 10.6% for the Stoxx600 NR), but currently displays a fall of -4.7% in 2018 against + 2.2% for the Stoxx600NR. The underperformance at the beginning of the year is mainly due to the poor performance of Nestlé (-7.6%), which is suffering from weakness in the North American market, Roche (8.3%) and Novartis (-5.6%) which consolidated after mixed results in Q417 and a high valuation.
The 2018 PER of the index remains high at around 20x earnings at 12 months, with earnings growth expected to rise 7/8%.
The premium paid on the Swiss market is due to the high quality of the companies that make up the index, and which are global players. The index is therefore influenced by world GDP growth, which is robust and should reach 4% in 2018. Note the lack of oil stocks which could be detrimental to the index during a period of strong recovery in oil prices
Weekly data
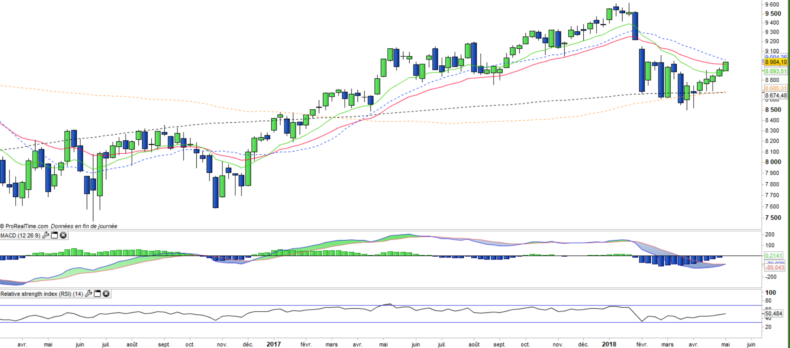
The weekly chart shows a medium-term trend that is starting up again after achieving a perfect rebound on the EMA200. The prices are joining the EMA20 before tackling the February gap. The MACD seems about to turn around, which would confirm the current reversal. The target of the coming weeks is to reach the peak of the year towards 9600 pts.
Daily data
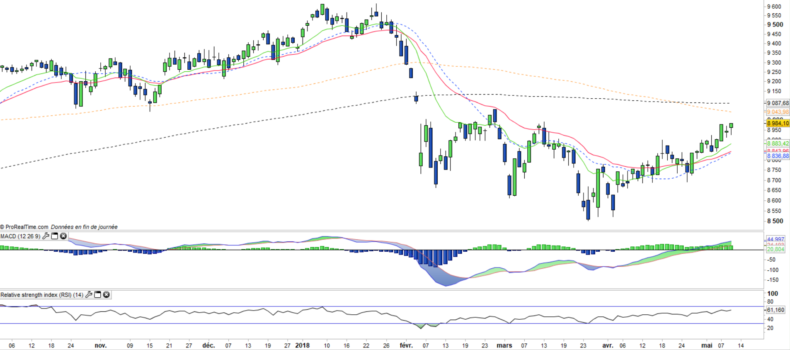
On the weekly chart, we can see that the SMI prices are just on the EMA100 and the EMA200 level which constitute a major pivotal level in the short term. In the event of confirmed overflow of this resistance, prices would again be clearly in a bullish trend in the short and medium term. But a pull-back is always possible, so it is better to wait for confirmation.
ETF Objective
CSSMI is an ETF listed in CHF, which seeks to replicate the Swiss Market Index (20 swiss companies)
Characteristics
| Inception date | 06/10/1999 |
| Expense ratio | 0,35% |
| Issuer | iShares |
| Benchmark | Swiss Market Index |
| ISIN | CH0008899764 |
| Ticker | CSSMI |
| Currency | CHF |
| Exchange | Switzerland |
| Assets Under Management | 2 103 M CHF |
| Replication method | Direct (Physical) |
| Dividend | Distribution |
| PEA (France) | No |
| SRD (France) | No |
| Number of Holdings | 20 |
| Risk | 3/5 |
Country Breakdown
| Switzerland | 100% |
Sector Breakdown
| Health Care | 36% |
| Financials | 22% |
| Consumer Staples | 18% |
| Industrials | 9% |
| Consumer discretionary | 7% |
| Materials | 6% |
| Others | 2% |
Top Ten Holdings
| Nestlé | 18% |
| Novartis | 18% |
| Roche Holding | 17% |
| UBS Group | 7% |
| Richemont | 5% |
| Zurich Insurance | 5% |
| Credit Suisse | 4% |
| ABB Ltd | 4% |
| Swiss Re | 3% |
| LafargeHolcim | 3% |


