Invesco Oil WTI - DBO - 08/01/19
Short Term strategy: Negative (10%) / Trend +
Long Term strategy: Negative (10%) / Trend -
Characteristics of the ETF
The DBO ETF (Invesco-Powershares) created in 05/2007 replicates the crude oil prices through future contracts on light sweet crude oil (WTI).
The costs of the DBO ETF are 0.75% and AUM amount to approximately $278M. Oil is a very volatile asset, and as any commodity does not give rise to a dividend and is a risky asset.
Alternative ETFs: OLO (Deutsche Bank USD), BNO (US Commodity Fund USD).
Latest developments
WTI petroleum rose +4.9 in 2017 after a rebound of 9.2% in 2016 and reversed down again with a drop of 21.2% in 2018 after a spectacular fall of 23% in November and by 34% since the october highs of $ 77. The WTI petole climbed 5.6% so far in 2019.
In early December, OPEC reduced production by 1.2million barrels a day, which allowed a first recovery of prices and especially a halt of the fall. OPEC could go further in production cut if the demand weakens while the minimum target is around $ 60. One of the big questions today is the level of demand for 2019 in a context of rapidly weakening growth in China and the West.
In the longer term, the production gap remains due to the lack of investment made by the majors since 2014, but in the short term the inflow of Iranian oil weighs on prices.
Index & components
Oil is a raw material that is a fossil fuel produced by a few countries like Saudi Arabia, the US, Russia, Iran, Iraq, Algeria or Nigeria.
It is extracted by drilling or hydraulic fracturing and is then delivered - processed / refined or not, in consumer countries, mainly European and Asian and can produce fuels such as gasoline, gas oil or kerosene once refined and processed chemically. Depending on its origin and final destination, oil has different names and its price may also vary. These differences in the price of oil depend on its quality. We differentiate the Arabian Light, which comes from the Middle East, the Brent oil that is produced in the North Sea, and finally the WTI or "West Texas Intermediate" which is produced in the United States and is the benchmark of the oil market.
The reference unit for oil is the barrel, which is actually about 159 liters. The price of a barrel of oil is quoted on the international market continuously, while two financial centers share its rating, namely New York for WTI and London for Brent.
Supply, therefore production and its stability are of course key determinants of the price of a barrel. It is OPEC, made up of several major world producing countries, which is in charge of determining - by consensus - how many barrels a day will be produced and its publications are therefore followed with attention by traders, as was the case recently. Demand factors are also critical. Thus, an increase in the energy needs of a major consumer country may have a greater or lesser influence on the price of the barrel. Globally, global growth is a very important factor for demand, while oil needs tend to shrink at equal demand, as new technologies tend to reduce consumption. In the long term, the electric car could cause a negative shock on global demand for crude oil, as China is investing heavily in renewable energy.
Since 2014, oil prices have divided by 3 due to a supply shock caused by the arrival on the market of American shale oil which has put very strong pressure on the oil-producing and oil companies that have significantly reduced their investments. This stoppage of industrial investment, in addition to OPEC's production cuts, has for the moment had a moderate bullish impact on crude prices. This is due to the plethoric production of unconventional oil (shale) that floods the market and counterbalances OPEC's reduction efforts.
Weekly data
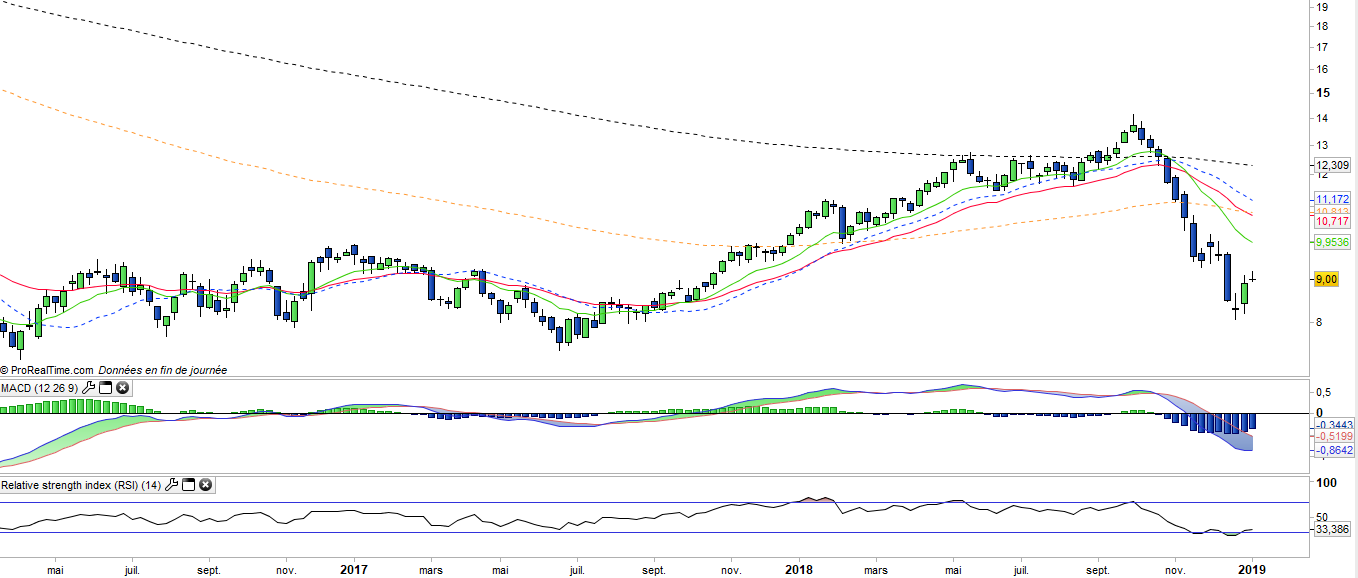
On the weekly chart, we see the formation of a medium-term bottom around the last 3 candlesticks. This figure comes after an extended fall which makes it more credible. The dividing line of the trend is determined by the EMA100 which is the main objective of this rebound. Only a confirmed overtaking of the EMA100 would confirm a bullish reversal.
Daily data
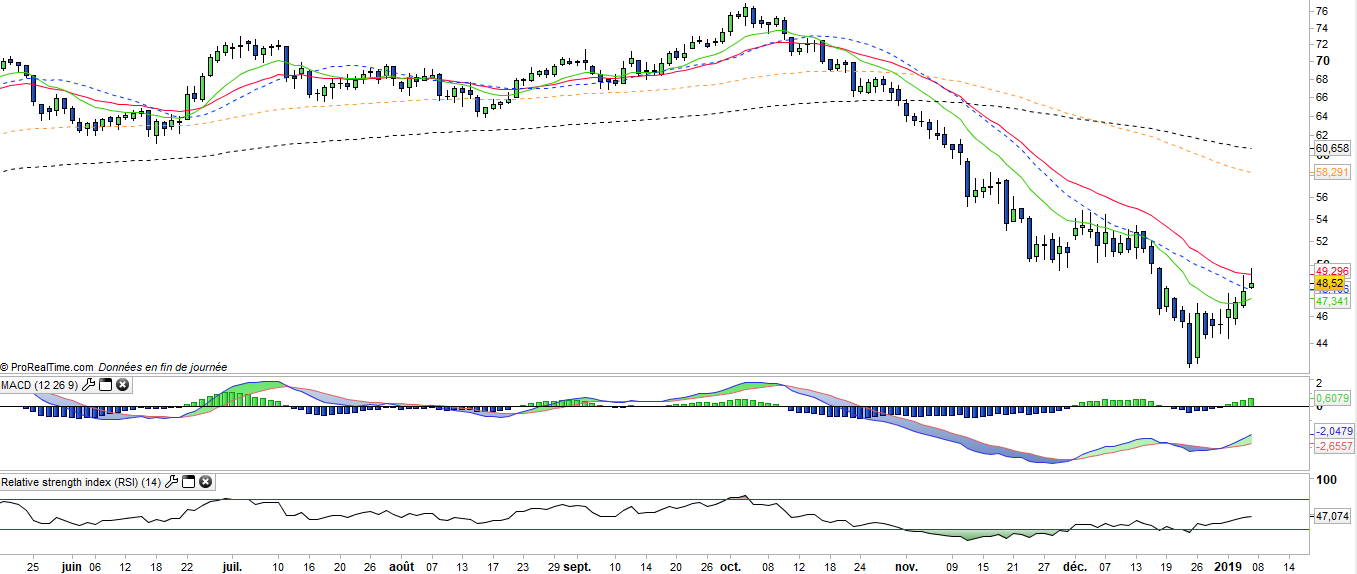
The daily chart shows a rebound that currently fails to overtake the EMA26 but has allowed the main technical oscillators to turn upward, which reinforces the technical configuration in the short term. Exceeding the EMA26 is key to the continuation of this rebound that would open a target in the area of EMA100 and 200 located at around 55 €.
ETF Objective
The Invesco DB Oil Fund seeks to replicate the level of the DBIQ Optimum Yield Crude Oil Index Excess Return
Characteristics
| Inception date | 01/05/2007 |
| Expense ratio | 0,78% |
| Issuer | Invesco |
| Benchmark | contrats "futures" WTI |
| code/ticker | DBO |
| ISIN | US73936B5075 |
| Currency | $ |
| Exchange | NYSE |
| Assets Under Management | 285 M$ |
| Dividend | No |
| Currency risk | No |
| Number of Holdings | NS |
| Risk | 4/5 |
Country Breakdown
| USA | 100% |
Sector Breakdown
| Oil WTI | 100% |
Top Ten Holdings
| Oil WTI | 100% |