PowerShares Oil WTI - DBO - 17/04/2018
Short Term strategy: Positive (90%) / Trend +
Long Term strategy: Positive (75%) / Trend +
Characteristics of the ETF
The DBO ETF (Invesco-Powershares) created in 05/2007 replicates the crude oil prices through future contracts on light sweet crude oil (WTI).
The costs of the DBO ETF are 0.75% and AUM amount to approximately $355M. Oil is a very volatile asset, and as any commodity does not give rise to a dividend and is a risky asset.
Alternative ETFs: OLO (Deutsche Bank USD), BNO (US Commodity Fund USD).
Latest developments
WTI oil rose for the second consecutive year in 2017 (+ 4.9%) after a rebound of 9.2% in 2016 and is now up 10.5% in 2018.
The rise in oil is mainly related to the recovery of a geopolitical bonus, while crises in the Middle East intensify with Russian-Western tensions around Syria and especially Iran in search of regional domination that dangerously opposes Israel and Saudi Arabia.
On May 12, the US could exit the nuclear deal with Iran which would probably cause a new crisis. Against the backdrop, the lack of investment in conventional oil wells since 2014 is beginning to impact supply, while shale oil production will not be able to maintain the fast pace of growth it is experiencing as a result of a bottleneck in terms of infrastructure and the limited duration of shale wells (3 years on average) which requires an increasing effort of renewal.
If global growth continues at this rate, global oil supply may start to become insufficient. More than ever, oil prices seem to be conditioned by world demand.
Index & components
Oil is a raw material that is a fossil fuel produced by a few countries like Saudi Arabia, the US, Russia, Iran, Iraq, Algeria or Nigeria.
It is extracted by drilling or hydraulic fracturing and is then delivered - processed / refined or not, in consumer countries, mainly European and Asian and can produce fuels such as gasoline, gas oil or kerosene once refined and processed chemically. Depending on its origin and final destination, oil has different names and its price may also vary. These differences in the price of oil depend on its quality. We differentiate the Arabian Light, which comes from the Middle East, the Brent oil that is produced in the North Sea, and finally the WTI or "West Texas Intermediate" which is produced in the United States and is the benchmark of the oil market.
The reference unit for oil is the barrel, which is actually about 159 liters. The price of a barrel of oil is quoted on the international market continuously, while two financial centers share its rating, namely New York for WTI and London for Brent.
Supply, therefore production and its stability are of course key determinants of the price of a barrel. It is OPEC, made up of several major world producing countries, which is in charge of determining - by consensus - how many barrels a day will be produced and its publications are therefore followed with attention by traders, as was the case recently.
Demand factors are also critical. Thus, an increase in the energy needs of a major consumer country may have a greater or lesser influence on the price of the barrel. Globally, global growth is a very important factor for demand, while oil needs tend to shrink at equal demand, as new technologies tend to reduce consumption.
In the long term, the electric car could cause a negative shock on global demand for crude oil, as China is investing heavily in renewable energy.
Since 2014, oil prices have divided by 3 due to a supply shock caused by the arrival on the market of American shale oil which has put very strong pressure on the oil-producing and oil companies that have significantly reduced their investments. This stoppage of industrial investment, in addition to OPEC's production cuts, has for the moment had a moderate bullish impact on crude prices. This is due to the plethoric production of unconventional oil (shale) that floods the market and counterbalances OPEC's reduction efforts.
Monthly data
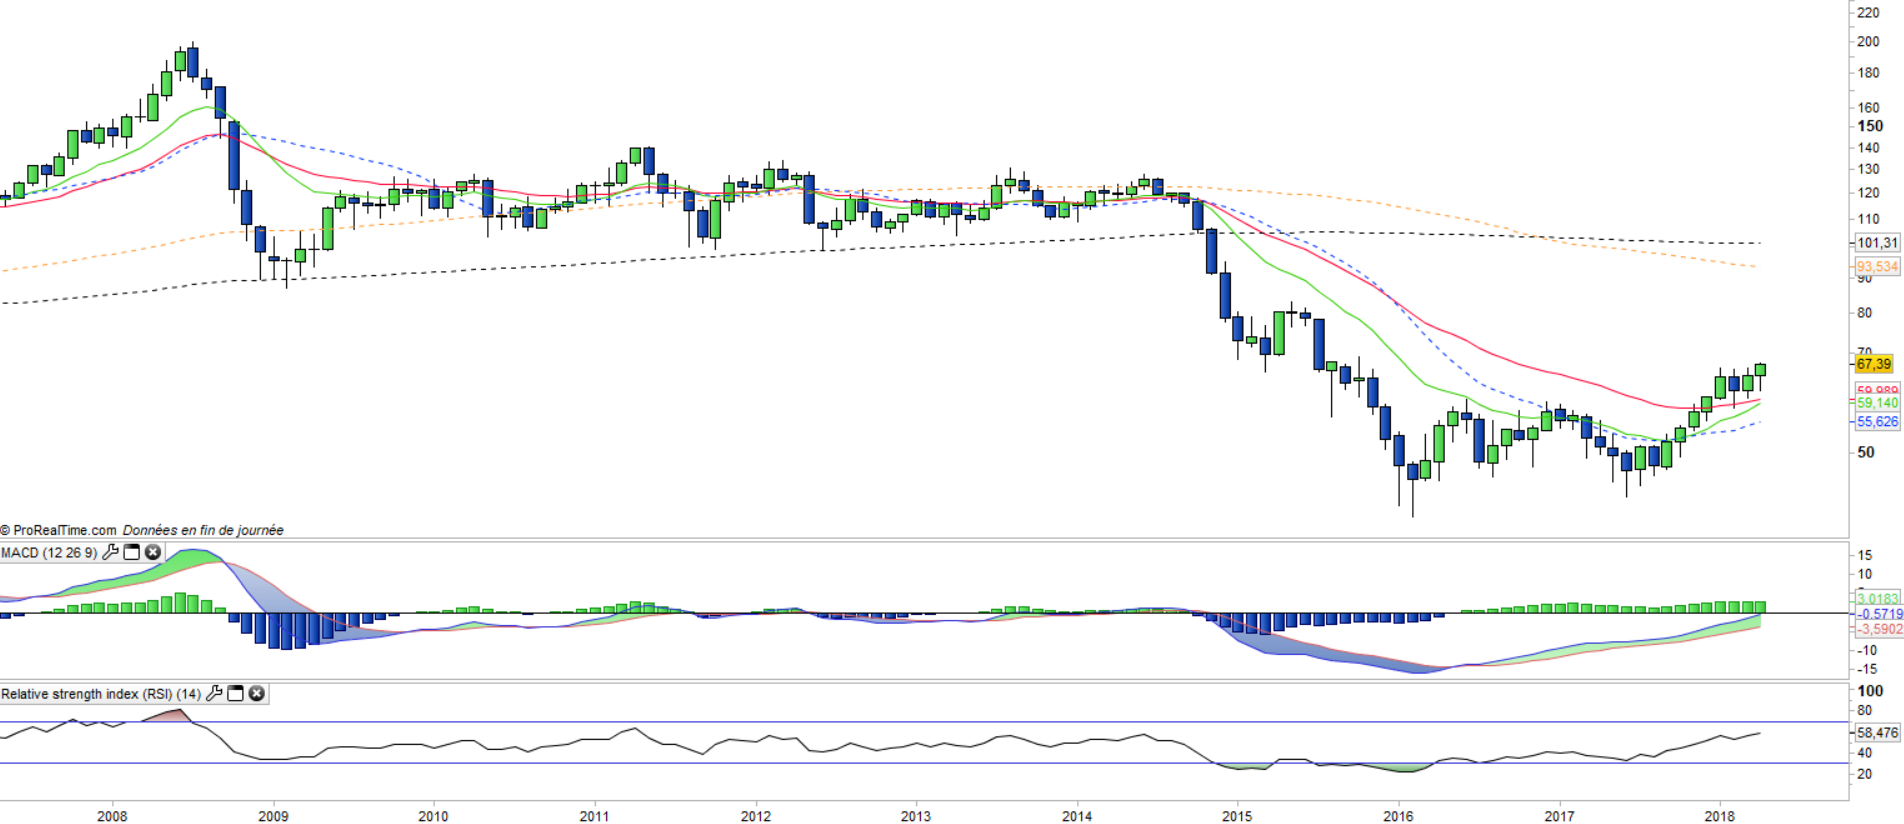
On the monthly chart, one can clearly see the long-term trend reversal that is taking place. This reversal will be definitively validated by the crossing of EMA13 and 26 which is happening. This signal should be confirmed simultaneously by the MACD which is about to cross its zero line. The primary objective of this long-term bullish signal is the EMA100 currently at $ 83.
Weekly data
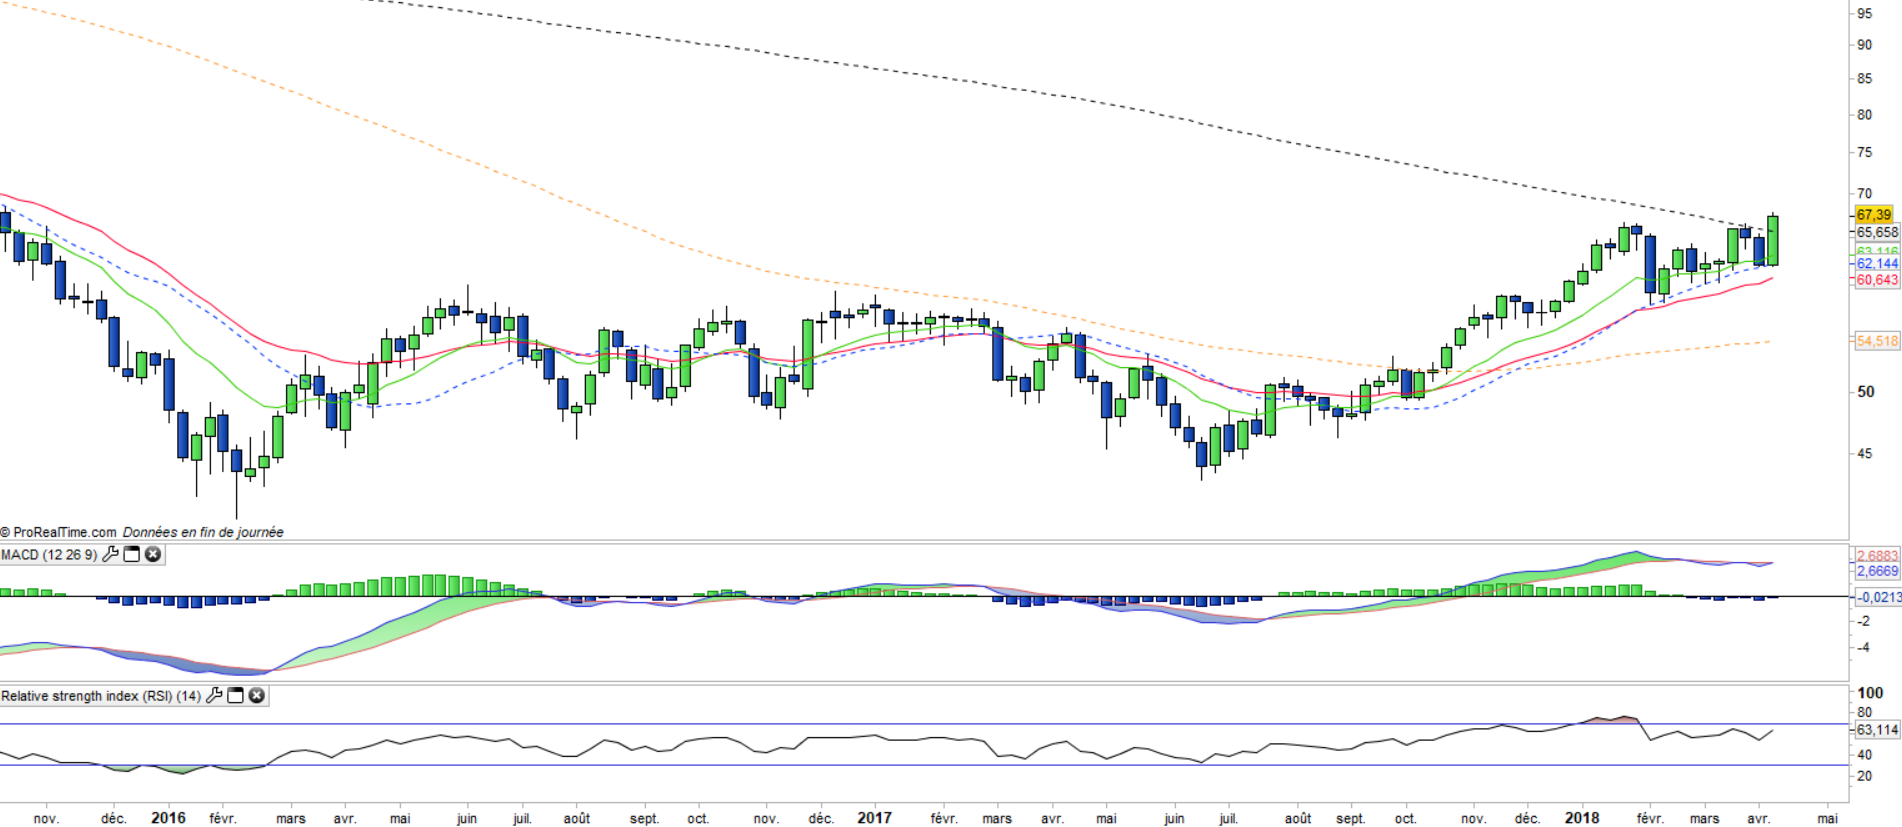
The weekly chart shows a new resistance attack materialized by the weekly EMA200 currently located on the $ 67 and which has been pounded since the beginning of the year. This resistance should eventually give way and open the way to $ 80 / $ 85, which is the peak of 2015. Exceeding this resistance would be a very bullish signal in the medium term.
ETF Objective
DBO is an ETF which seeks to replicate the DBIQ Optimum Yield Crude Oil Index Excess Return
Characteristics
| Inception date | 01/05/2007 |
| Expense ratio | 0,78% |
| Issuer | Powershares (Invesco) |
| Benchmark | DBIQ Optimum Yield Crude Oil Index Excess Return |
| code/ticker | DBO |
| ISIN | US73936B5075 |
| Currency | $ |
| Exchange | NYSE |
| Assets Under Management | 355 M$ |
| Dividend | No |
| Currency risk | No |
| Number of Holdings | NS |
| Risk | 4/5 |
Country Breakdown
| USA | 100% |
Sector Breakdown
| WTI Oil | 100% |
Top Ten Holdings
| WTI Oil | 100% |