DBO is an ETF (Invesco-Powershares) which replicates oil prices through futures contracts on the light sweet crude oil ( WTI).
The DBO's costs amount to 0.75%, which is rather in the higher range of our selection. Oil is a very volatile asset, and as any commodity does not give rise to a dividend and is a risky asset. AUM amounts to approximately $1740M.
Alternative ETFs: OLO (Deutsche Bank, USD), BNO (US Commodity Fund, USD).
Index & components
Oil is a commodity that is a fossil energy produced by a few countries like Saudi Arabia, USA, Russia, Iran, Iraq, Algeria or Nigeria. It is extracted by drilling (now also by hydraulic fracking) and is then delivered -transformed / refined or not, in consumer countries, mainly European and Asian and allows to produce fuels such as gasoline, gas oil or kerosene once refined and chemically treated. Depending on its origin and final destination, oil carries different names and its price may also vary. These observed differences in the price of oil depend on its quality. The Arabian Light, which comes from the Middle East, is distinguished by Brent oil produced in the North Sea and WTI or West Texas Intermediate, which is produced in the United States and is the reference quotation of the oil market. The unit of reference used for oil is the barrel which actually corresponds to about 159 liters.
The price of a barrel of oil is quoted on the international market continuously, while two financial places share its quotation, namely New York for the WTI and London for the Brent. Supply, and therefore production and its stability, are of course a determining factor in the price of a barrel. It is OPEC, made up of several major world producer countries, which is in charge of determining - by consensus - how many barrels will be produced per day and its publications are therefore followed closely by traders, as was the case recently. Demand-side factors are also paramount. Thus, an increase in the energy needs of a large consumer country may have a greater or lesser influence on the price of a barrel. Globally, global growth is a very important factor in demand, while oil demand decrease structurally as new technologies tend to reduce consumption. In the long term, the electric car could lead to a negative shock on world crude demand, as well as China, which invests heavily in renewable energies.
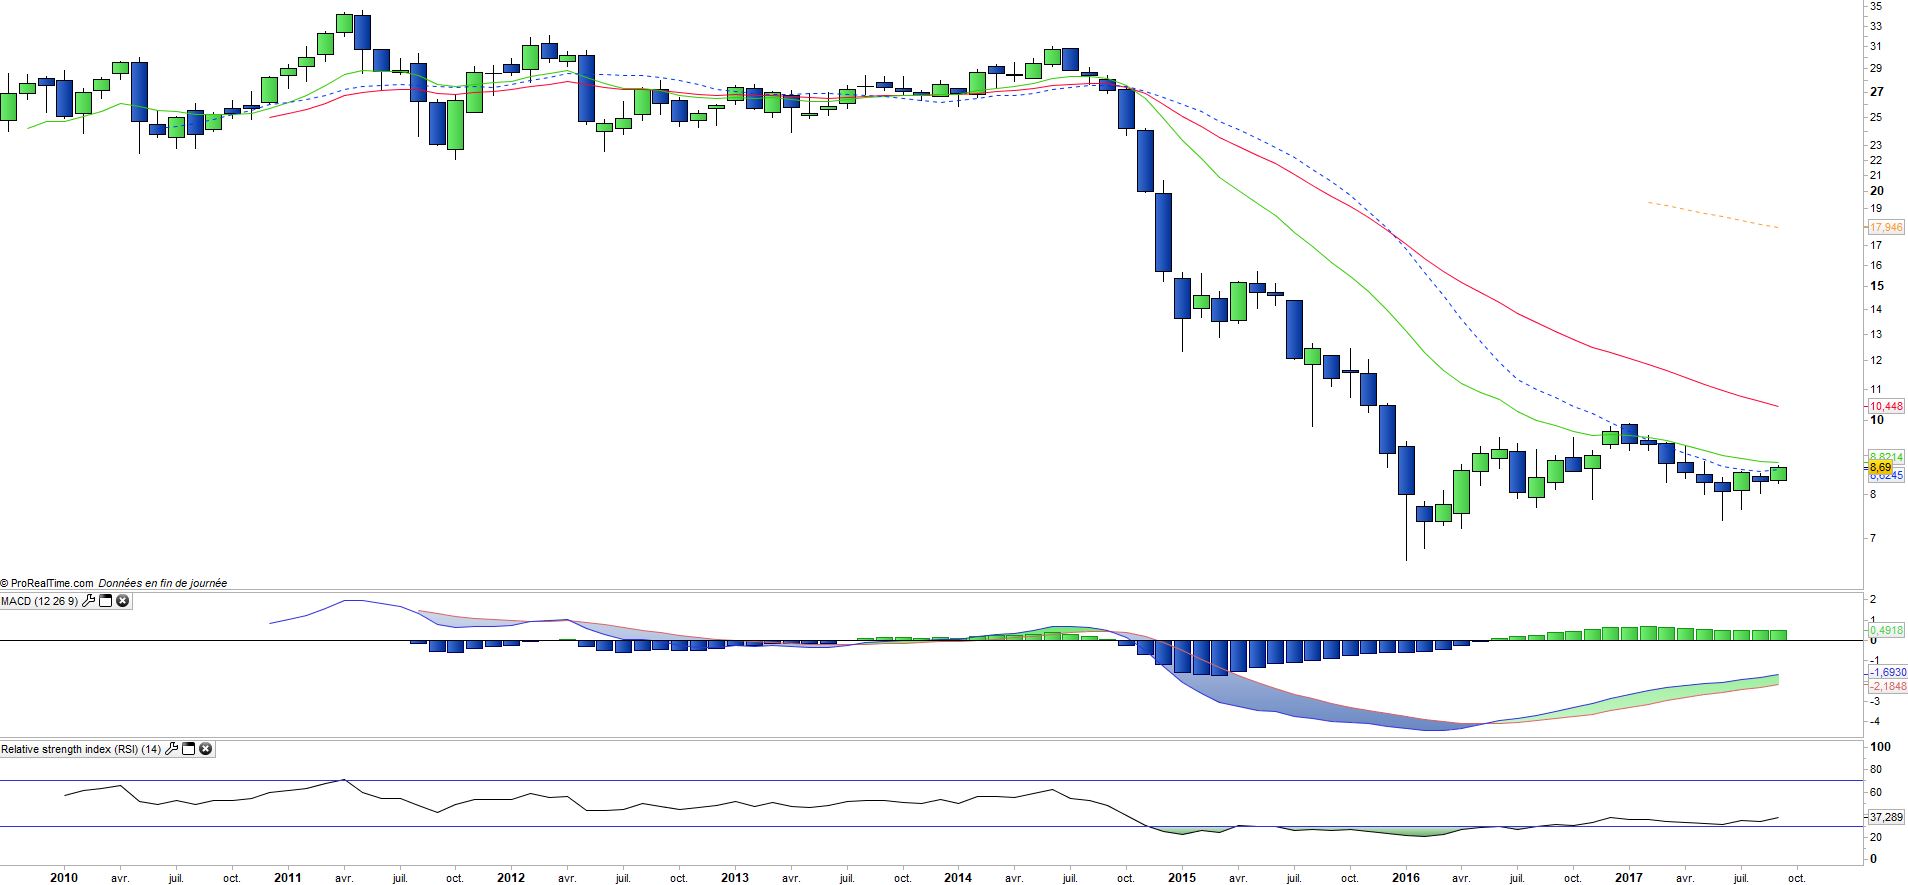
Since 2014, oil prices have been cut by a factor of three due to a supply shock caused by the arrival of US shale oil, which exerted considerable pressure on oil-producing countries and large Oil companies that have severely reduced their investment. This stoppage in industrial investment, coupled with OPEC production cuts, has for the moment had a very modest upward impact on crude oil prices. At issue is the over-production and supply of unconventional oil (shale) that floods the market and counteracts OPEC's reduction efforts.
Latest developments
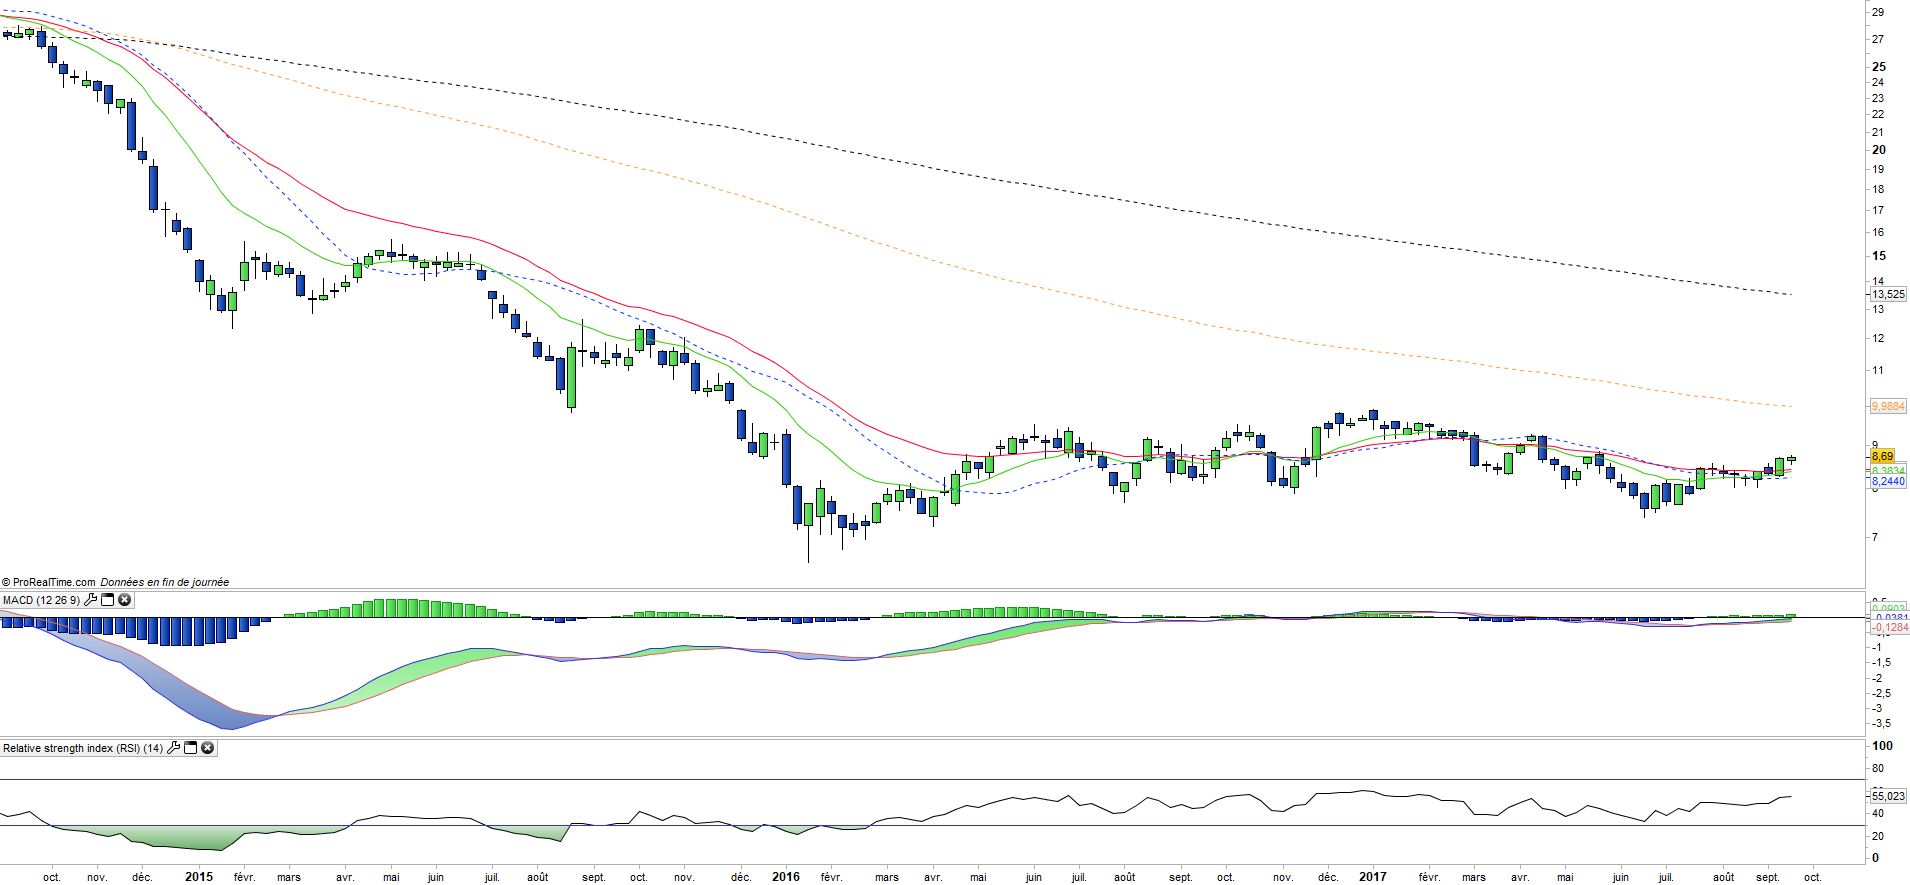
WTI is fairly stable (-1.9% since the beginning of the year), despite the agreement on OPEC reduction cuts of 1.8 million barrels per day (but not deepened) until March 2018.
The various stakeholders (including Russia and Iraq) encouraged by a relative stabilization on stocks would be more inclined to deepen this agreement - in terms of duration and amount - in the coming months, which supports the crude prices for a few weeks. In addition, the damage caused by the hurricanes in the Gulf of Mexico slowed production, which is another short-term catalyst coupled with the pending fall of Venezuela and a weaker dollar, which reinforces the demand coming from Europe and Asia. Medium-term trends (production of oil over-55) and long-term (batteries, renewables, technology) are negative. A collapse in crude oil prices is not excluded in the long run, as no natural support appears to be emerging on the horizon, apart from a drastic reduction in capacity.
However, shale oil could face a transition step in terms of infrastructure in the coming months, which could slow down the output growth for some time.