The DBO ETF (Invesco-Powershares) created in 05/2007 replicates the crude oil prices through future contracts on light sweet crude oil (WTI).
The costs of the DBO ETF are 0.75% and AUM amount to approximately $389M. Oil is a very volatile asset, and as any commodity does not give rise to a dividend and is a risky asset.
Alternative ETFs: OLO (Deutsche Bank USD), BNO (US Commodity Fund USD).
Latest developments
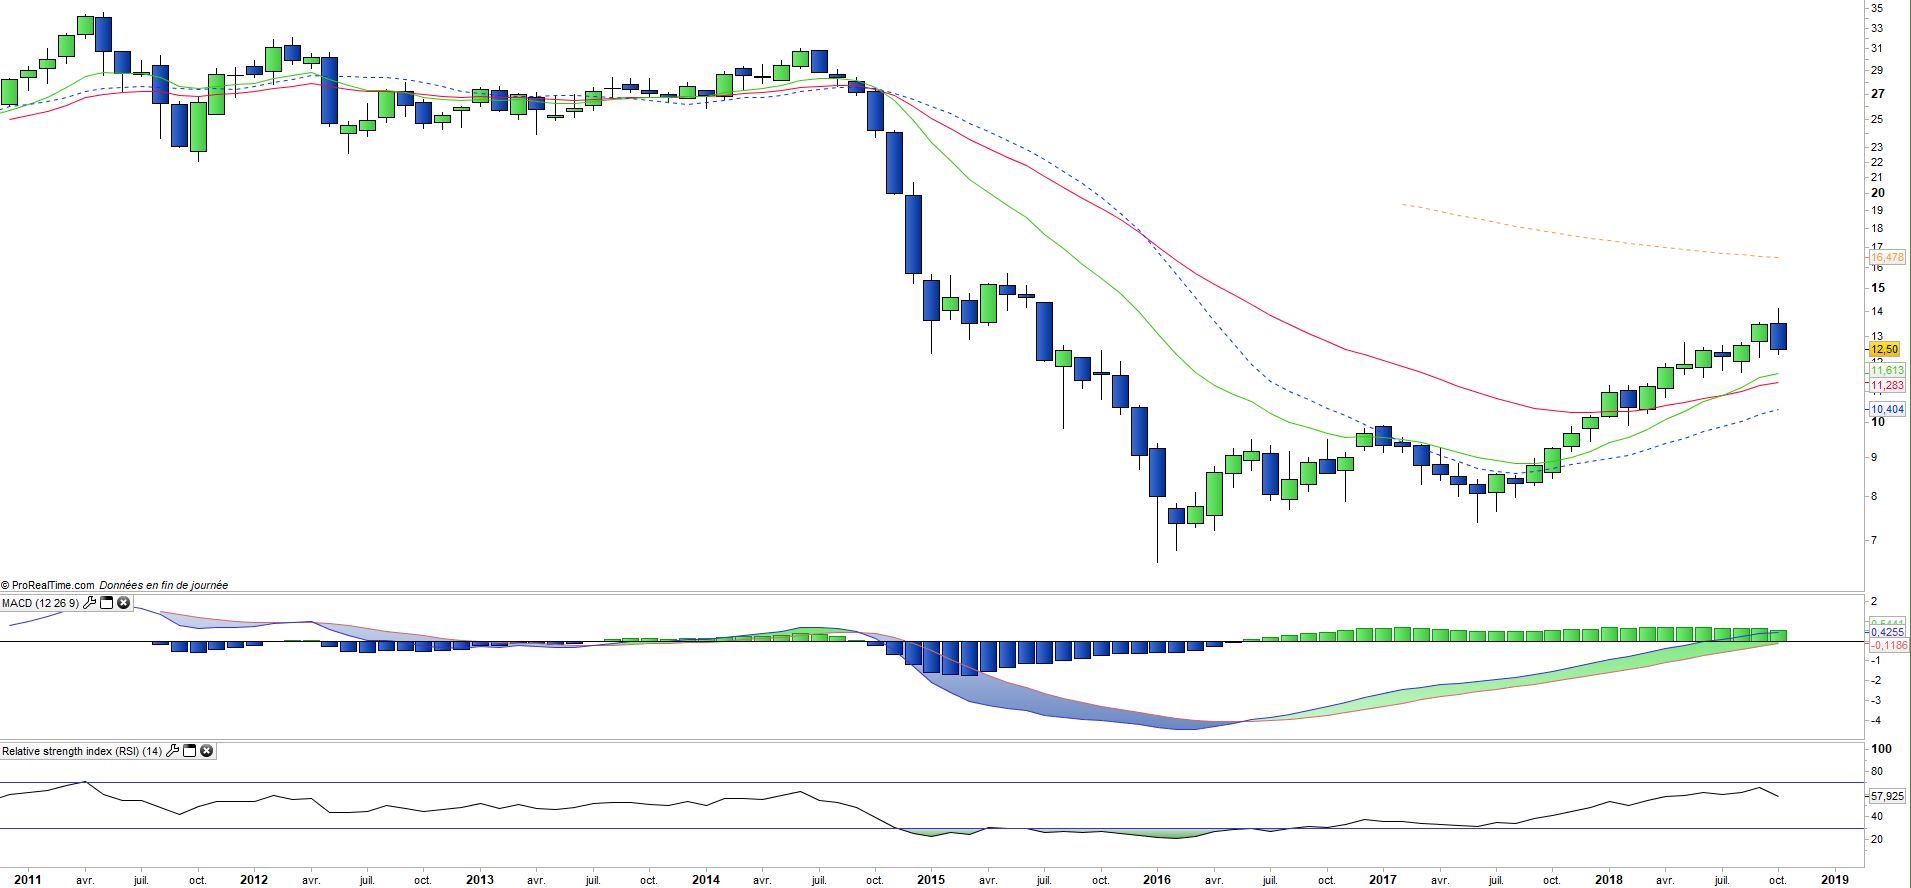
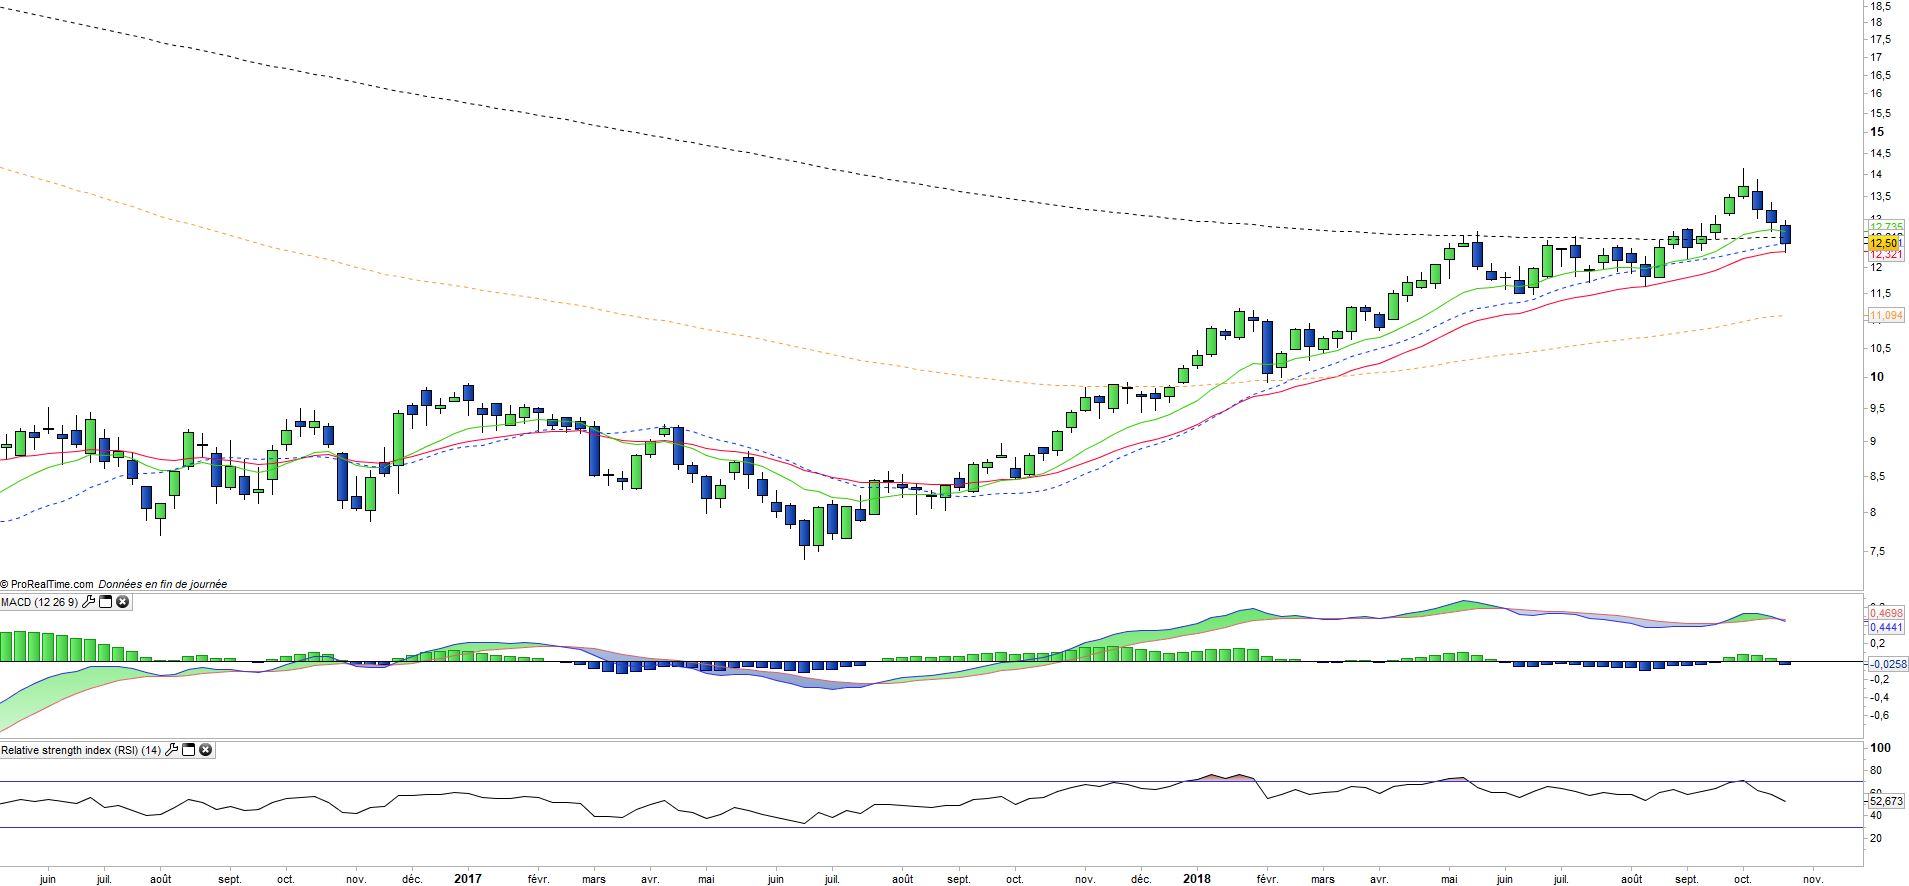
WTI oil rose for the second year in a row in 2017 (+ 4.9%) after a rebound of 9.2% in 2016 and accelerated further to 16.7% in 2018.
However, the scandal that is currently shaking Saudi Arabia is bad for crude prices, because the US is forced to drop the ballast on Iran and is in a position to demand also more flexibility to the Kingdom on the production of oil which prices momentum penalizes the American economy and feeds the inflation. However this situation is temporary and should not change the alliances or balances in the Middle East, even if Saudi Arabia comes out weakened.
The production gap, resulting from the lack of investment by the majors since 2014, should result in a supply deficit around 2020 if demand remained so strong. As a result, crude prices have become very sensitive to global growth.
Index & components
Oil is a raw material that is a fossil fuel produced by a few countries like Saudi Arabia, the US, Russia, Iran, Iraq, Algeria or Nigeria.
It is extracted by drilling or hydraulic fracturing and is then delivered - processed / refined or not, in consumer countries, mainly European and Asian and can produce fuels such as gasoline, gas oil or kerosene once refined and processed chemically. Depending on its origin and final destination, oil has different names and its price may also vary. These differences in the price of oil depend on its quality. We differentiate the Arabian Light, which comes from the Middle East, the Brent oil that is produced in the North Sea, and finally the WTI or "West Texas Intermediate" which is produced in the United States and is the benchmark of the oil market. The reference unit for oil is the barrel, which is actually about 159 liters.
The price of a barrel of oil is quoted on the international market continuously, while two financial centers share its rating, namely New York for WTI and London for Brent. Supply, therefore production and its stability are of course key determinants of the price of a barrel. It is OPEC, made up of several major world producing countries, which is in charge of determining - by consensus - how many barrels a day will be produced and its publications are therefore followed with attention by traders, as was the case recently. Demand factors are also critical. Thus, an increase in the energy needs of a major consumer country may have a greater or lesser influence on the price of the barrel.
Globally, global growth is a very important factor for demand, while oil needs tend to shrink at equal demand, as new technologies tend to reduce consumption. In the long term, the electric car could cause a negative shock on global demand for crude oil, as China is investing heavily in renewable energy. Since 2014, oil prices have divided by 3 due to a supply shock caused by the arrival on the market of American shale oil which has put very strong pressure on the oil-producing and oil companies that have significantly reduced their investments. This stoppage of industrial investment, in addition to OPEC's production cuts, has for the moment had a moderate bullish impact on crude prices. This is due to the plethoric production of unconventional oil (shale) that floods the market and counterbalances OPEC's reduction efforts.