The DIA ETF (SPDR) replicates the Dow Jones Industrial Average index, which is composed of the 30 main US stocks, the "blue chips", selected according to the size of their market capitalization.
The DIA ETF is currently the benchmark tracker to replicate the most prestigious and old US index with fees limited to 0.17% and AUM of $ 21145M. Replication is direct (physical) and there is a policy of distributing dividends on a monthly basis.
Alternative ETFS: IYY (iShares in USD)
Latest developments
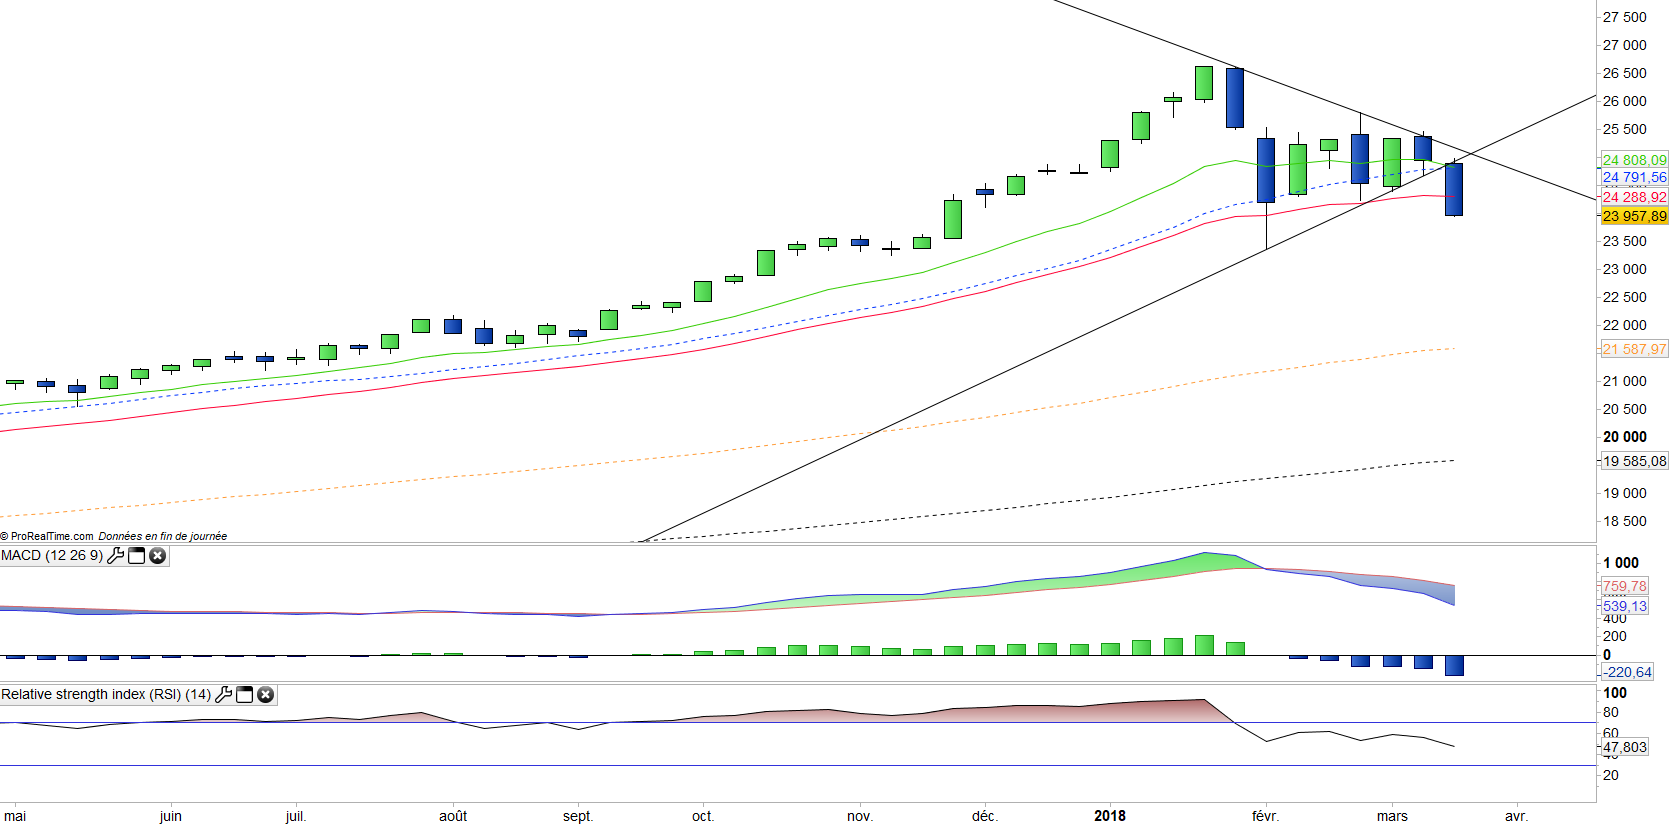
The DJIA grew by 25.1% in 2017, and has decreased by 3.1% since the beginning of 2018. The FED announced Wednesday, as expected by most investors, a rise of 25bp from its main policy rate, the fed funds rate has been raised from 1.50% to 1.75 and the FED consider the US economic outlook has strengthened. The rates are expected at 2.1% at the end of 2018 (2 new increases as planned), then at 2.9% at the end of 2019 (3 increases or 1 more than expected) and 3.4% at the end of 2020 (two increases), compared to 2.1%, 2.7% and 3.1% respectively in December.
At the same time, D. Trump has caused the fall of markets that fear a trade war after the signing of a presidential decree establishing customs barriers on 50 to 60 billion dollars of Chinese products imported into the United States.
Index & components
For a US company, integrating the Dow Jones is considered a consecration, so much must be established to achieve it, so sit there as America's iconic companies like IBM, Coca Colas, Boeing or Goldman Sachs.
The value of this index is primarily the quality and robustness of its components, while the average market capitalization is $ 236 bn, with a balanced sector weighting of which the 3 main sectors are industrial stocks (24.2%) includingbig names such as 3M, Dupont de Nemours or Boeing, financial stocks (16.8%) with the big American banks, the technological sector (17%) including the most established names like IBM, Apple and Microsoft.
The DJIA is a much narrower index than the S & P500 and may be more volatile, for example when financial stocks are under pressure. The Dow Jones multiples are currently around 20x 2018 results, which is clearly in the high average (historically between 15 and 20x) but must be compared to a growth of the economy of over 2% in a context of still low interest rates and an industry sensitive to oil prices that has begun to rise.
The index has been posting record highs for the last few months, and has recently climbed the 25,000 pts threshold. The index benefited from the election of D.Trump and his promises of a massive infrastructure program (pending), tax cuts (done) and the announced deregulation of banks that also benefits these sectors. The new round of rate hikes should remain gradual unless the signs of inflation intensify, while the US dollar is falling against the Euro and other currencies which should benefit US companies, especially since the profit margins of companies are at the top of the cycle.
The upward trend of the index, which has lasted for 8 years, seems to suggest that the longevity of the cycle is linked to the low rate / moderate growth pair that may still last for some time.