SPDR ETF Dow Jones - DIA - 23/04/2018
Short Term strategy : Negative (70%) / Trend =
Long Term strategy: Positive (95%) / Trend =
Characteristics of the ETF
The DIA ETF (SPDR) replicates the Dow Jones Industrial Average index, which is composed of the 30 main US stocks, the "blue chips", selected according to the size of their market capitalization.
The DIA ETF is currently the benchmark tracker to replicate the most prestigious and old US index with fees limited to 0.17% and AUM of $ 21808M. Replication is direct (physical) and there is a policy of distributing dividends on a monthly basis.
Alternative ETFS: IYY (iShares in USD)
Latest developments
The DJIA increased by 25.1% in 2017, and has decreased by 1% since the beginning of 2018.
The US index is becoming less and less directional, because of a rather high valuation, of a growth cycle that seems closer to the end than the middle and multiple threats such as a possible trade war with China or a resumption of inflation with a rise in long rates.
At the same time, in the short term corporate profits should benefit from the massive tax cuts granted by the US administration and incentives to repatriate cash from large groups in the country.
The oil sector is increasingly boosted by the price of crude, which is a bullish factor for the index at first, and that offsets a technological sector weakened by the Facebook scandal on user data and attacks from D.Trump on Amazon.
Index & components
For a US company, integrating the Dow Jones is considered a consecration, so much must be established to achieve it, so sit there as America's iconic companies like IBM, Coca Colas, Boeing or Goldman Sachs.
The value of this index is primarily the quality and robustness of its components, while the average market capitalization is $ 228 bn, with a balanced sector weighting of which the 3 main sectors are industrial stocks (23.8%) including big names such as 3M, Dupont de Nemours or Boeing, financial stocks (16.9%) with the big American banks, the technological sector (17.8%) including the most established names like IBM, Apple and Microsoft.
The DJIA is a much narrower index than the S & P500 and may be more volatile, for example when financial stocks are under pressure. The Dow Jones multiples are currently around 20x 2018 results, which is clearly in the high average (historically between 15 and 20x) but must be compared to a growth of the economy of over 2% in a context of still low interest rates and an industry sensitive to oil prices that has begun to rise. The index has been posting record highs for the last few months, and has recently climbed the 26,000 pts threshold.
The index benefited from the election of D.Trump and his promises of a massive infrastructure program (pending), tax cuts (done) and the announced deregulation of banks that also benefits these sectors.
The new round of rate hikes should remain gradual unless the signs of inflation intensify, while the US dollar is now stable against the Euro and other currencies which should benefit US companies, especially since the profit margins of companies are at the top of the cycle.
The upward trend of the index, which has lasted for 8 years, seems to suggest that the longevity of the cycle is linked to the low rate / moderate growth pair that may still last for some time.
Daily data
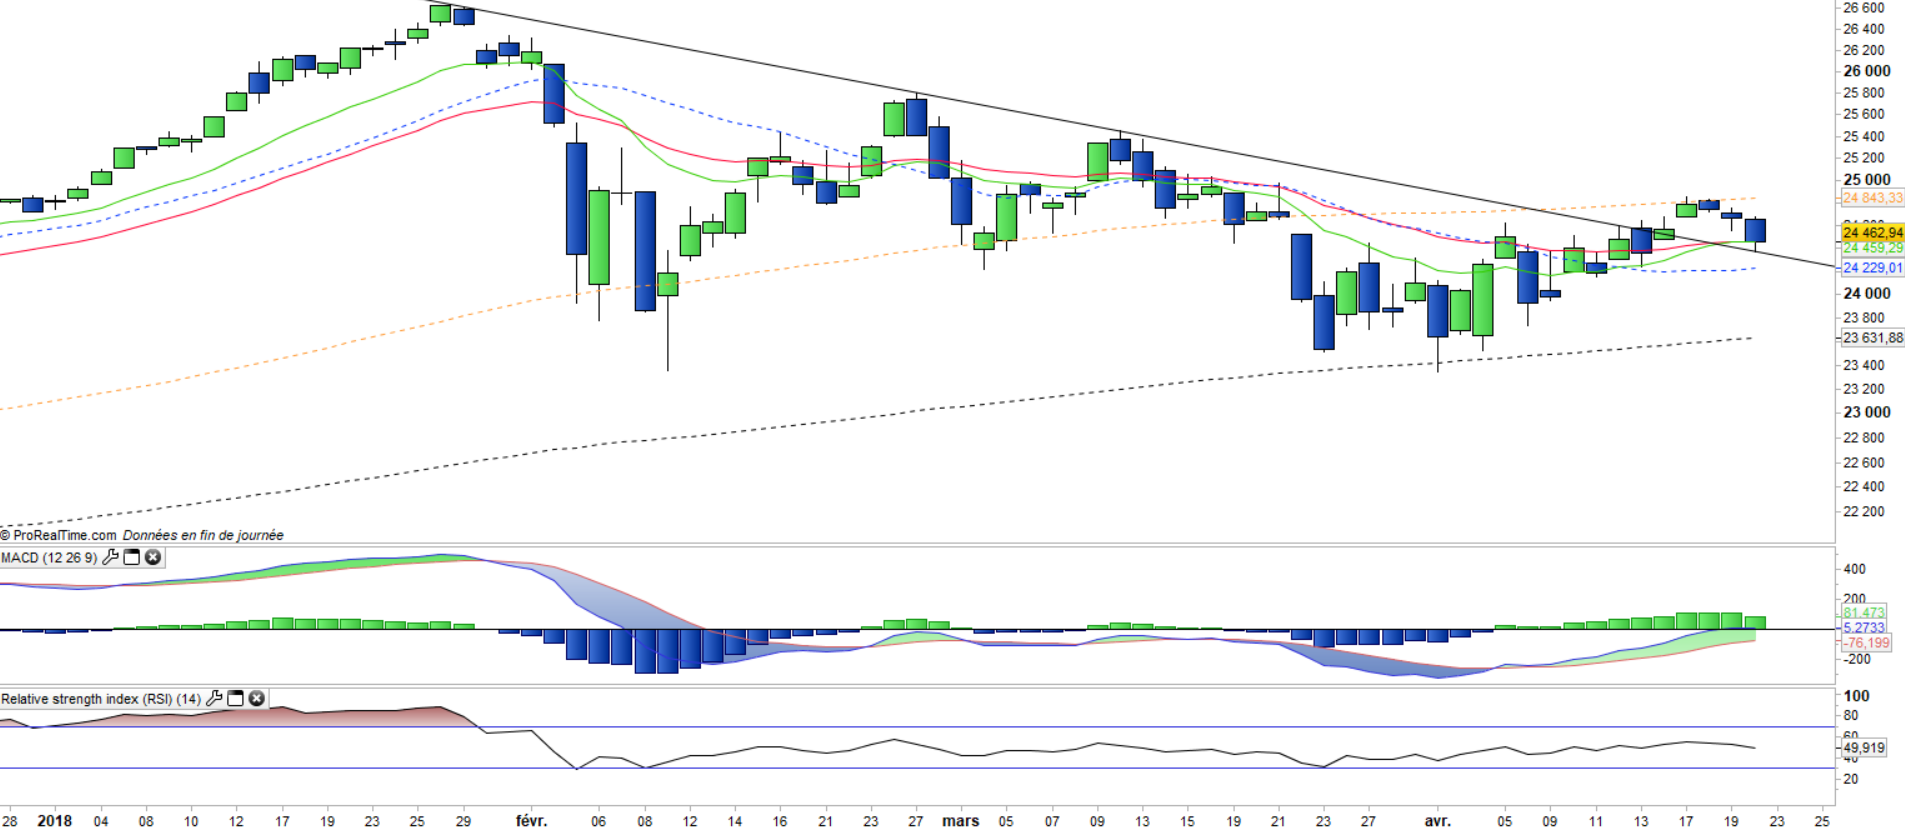
The daily chart shows a short-term bullish recovery that retests the EMAs13 and 26 that are about to cross. A rebound on these levels would be logical and would confirm the bullish recovery while the bearish line was broken last week. The technical oscillators also seem to favor the bullish recovery in the short term.
Weekly data

On the weekly chart, we can see that the prices failed to excess the weekly EMA20. However, the rise is not called into question as long as the index remains above its EMA26 currently at the 24250 ptslevel. The EMA20 is now the main resistance to overcome for the development of a new wave of rise
ETF Objective
DIA is an ETF listed in USD, which seeks to replicate the DJIA index (30 US companies)
Characteristics
| DInception date | 14/01/1998 |
| Expense ratio | 0,17% |
| Issuer | SPDR |
| Benchmark | Dow Jones Industrial Average |
| Code/Ticker | DIA |
| ISIN | US78467X1090 |
| UCITS | No |
| Currency | $ |
| Exchange | NYSE Arca |
| Assets Under Management | 21 464 M$ |
| Dividend | distribution |
| Currency risk | No |
| Number of Holdings | 30 |
| Risk | 3/5 |
Country Breakdown
| USA | 100% |
Sector Breakdown
| Industrials | 24% |
| Information Technology | 18% |
| Financials | 17% |
| Consumer Discretionary | 14% |
| Health Care | 13% |
| Consumer Staples | 6% |
| Energy | 6% |
| Materials | 2% |
| Telecommunication Services | 1% |
Top Ten Holdings
| Boeing | 10% |
| Goldman Sachs | 7% |
| UnitedHealth Group | 7% |
| 3M Company | 6% |
| Apple | 5% |
| Home Depot | 5% |
| McDonald's Corp | 4% |
| Caterpillar | 4% |
| IBM | 4% |
| Travelers Companies | 4% |