The DIA ETF (SPDR) replicates the Dow Jones Industrial Average index, which is composed of the 30 main US stocks, the "blue chips", selected according to the size of their market capitalization.
The DIA ETF is currently the reference tracker to replicate the most prestigious and old US index with fees limited to 0.17% and AUM of $ 19,362m.
Replication is direct (physical) and dividends are distributed on a monthly basis.
Alternative ETFs: CIND ( iShares, USD), DJE (Lyxor, Euro)
Index & components
For a US company, integrating the Dow Jones is considered a consecration, so it is reserved only the for the much established one, as America's iconic companies like IBM, Coca Cola, Boeing or Goldman Sachs.
The interest of this index is primarily the quality and the robustness of its components while the average market capitalization within it is of 215md $, with a balanced sectorial weighting whose 3 main sectors are the industrials(22.4%) including big names like 3M, Dupont de Nemours or Boeing, financial stocks (16.7%) including the big American banks, the technological sector (17%) including the most established companies like IBM, Apple and Microsoft.
The DJIA is a much narrower index than the S & P500 and may be more volatile, for example when financial stocks are under pressure. The multiples of the Dow Jones are currently around 19x forward results, which is rather high (historically between 15 and 20x) but must be put into perspective by the fall in profits of banks and especially energy-related businesses in 2016 and should be viewed as a result of a GDP growth above 2% in a low interest rate environment.
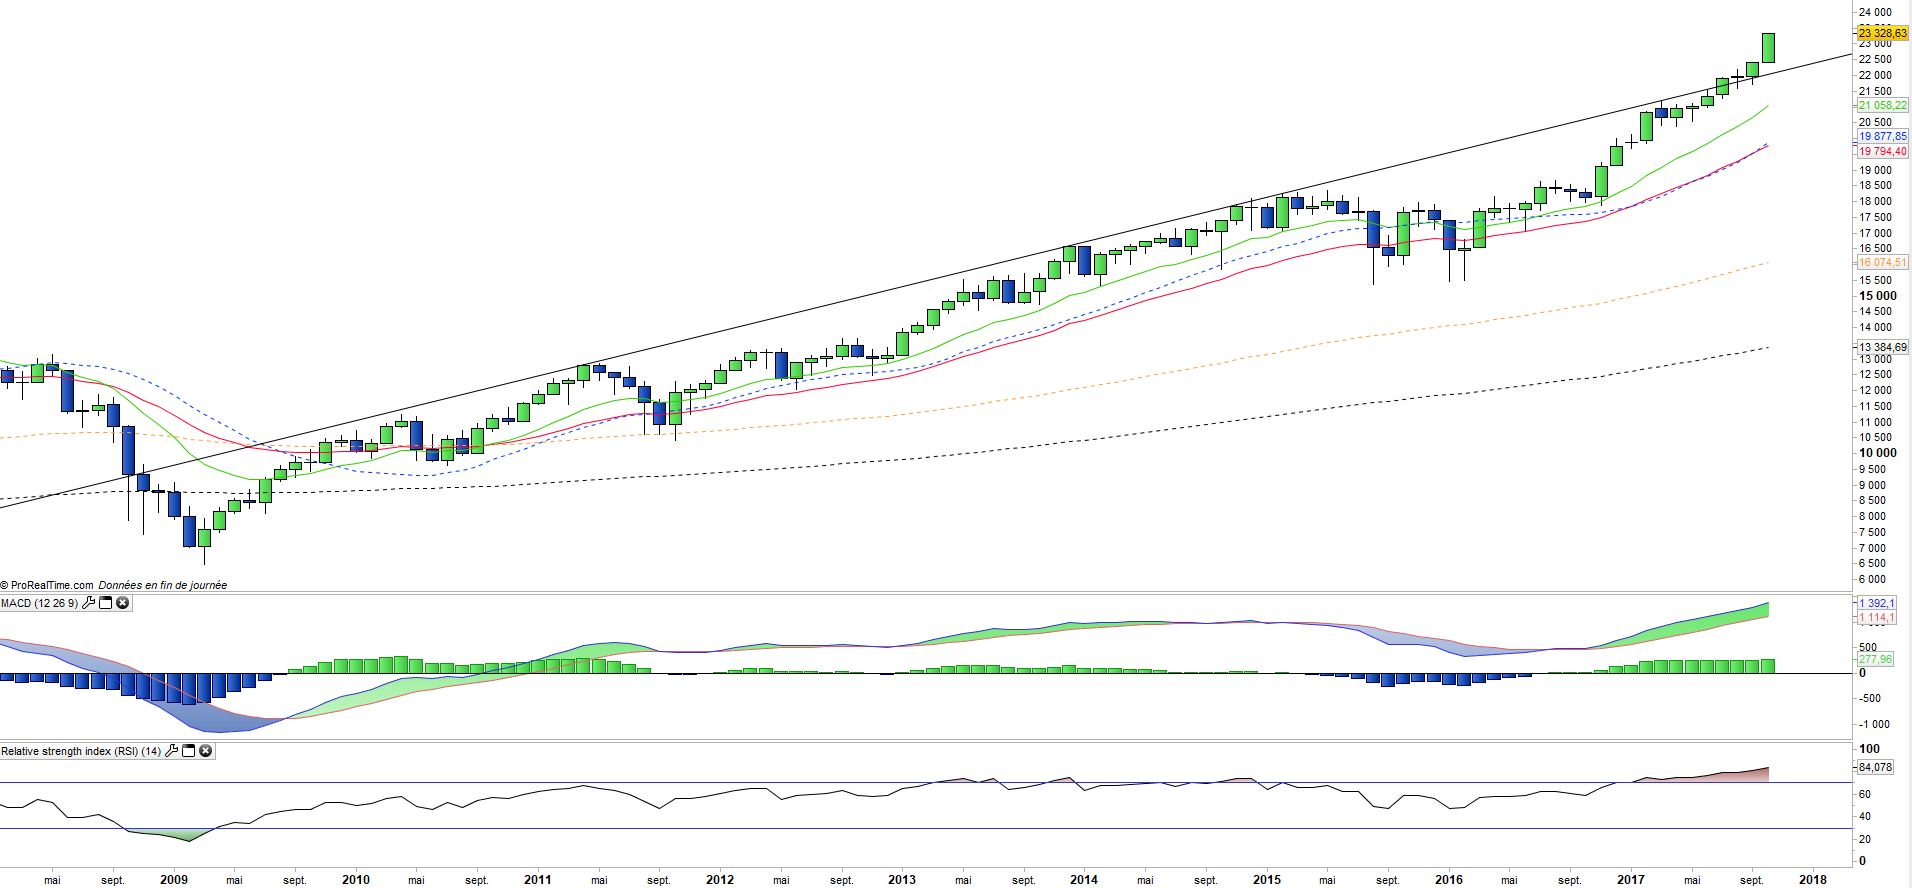
The index has regularly posted record highs in recent weeks, having crossed the threshold of 23,000 pts, it is now heading to 25,000 pts. The index benefited from the election of D.Trump and his promise of a massive infrastructure program, tax cut and the announced deregulation of banks that also benefits these sectors. The new round of rate hikes will, according to the latest Fed statements, be very gradual and should not pose a threat to US growth in the coming months as the dollar is falling against the Euro and 'other currencies which should benefit American companies, especially since the corporate margins are at the top of the cycle.
The very low volatility as well as the upward trend in the index, which has lasted for 8 years, suggest that the situation of low rates / moderate growth may still last for some time.
Latest developments
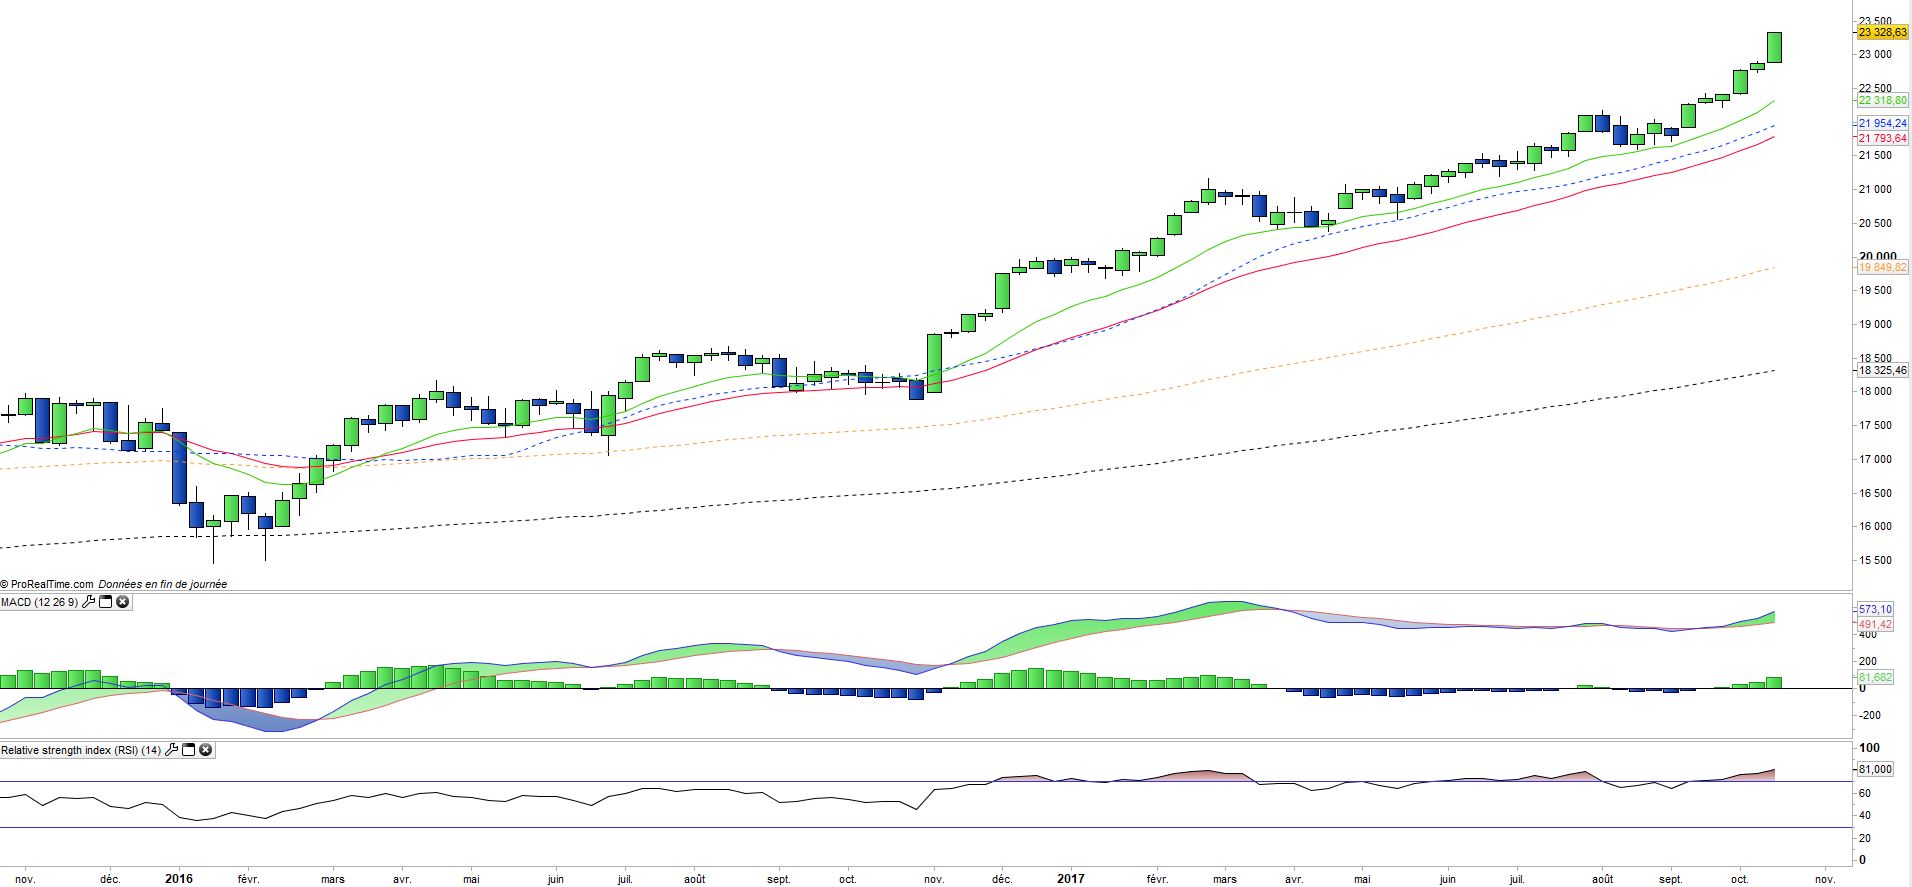
The DJIA has risen by 18% since the beginning of the year, after a rise of 13.4% in 2016. The acceleration of the index in October (+ 4%) is essentially linked to the announcement of the Trump’s plan of tax cuts (including the shift from corporate tax from 35% to 20%) while the markets are counting on the fact that the congress will not oppose the plan despite additional costs of $ 1500bn on 10 years. This fiscal stimulus plan had no impact on the ongoing rebound of the Euro against the dollar, which gives oxygen to US companies. The accommodative policy of the FED should last as long as the absence of inflation allows for a very gradual rise in rates. The fiscal stimulus could have an inflationary impact, but that should remain moderate, judging by the reaction of long US rates this week (+10 BP). A third rate hike is likely in December (25 bp) followed by two more in 2018, which should be absorbed by the economy. The name of the new boss of the FED should be known in a few weeks, Mrs Yellen can be renewed, but 4 other candidates are in the running. The continuation of a low interest rate environment and growth around 2% may allow the US cycle to continue for some time, but the current valuations are demanding and the rise in the index seems difficult to sustain and could lead to excess.