iShares China large cap ETF (FXI) - 03/09/2018
Short Term strategy: Negative (10%) / Trend -
Long Term strategy: Negative (30%) / Trend -
Characteristics of the ETF
The FXI ETF (iShares) created in 10/2004 is listed in US dollar on the NYSE and replicates the FTSE China 50 Index which is composed of the main Chinese stocks listed in Hong Kong and composed for more than half of the capitalization of financial values. These shares are subject to the Chinese regulation but denominated in Hong Kong dollar (HKD). Chinese H shares, unlike A shares, are available to non-resident investors in China.
The fees of this ETF are 0.74% for AUM of $ 4728M. The replication method is physical and there is a semi-annual dividend distribution policy.
Alternative ETFs: CSIA (Lyxor in Euro), CC1 (Amundi in Euro)
Latest developments
After a 33% rise in 2017, FXI is down -8.2% in 2018 while China is now in the middle of a row with the Trump administration on trade, after spectacular announcements of tarifs increases by USA, first $ 50bn that have already come into force, then $ 200bn to be added in the coming days.
The US president said he was ready to go as far as taxing all Chinese imports, ie $ 500 billion. Chinese growth is so far not currently affected by these measures but it may not last especially if the US administration is going to the end of its threats. A compromise could take long months to set up, with risks on the rise for the two largest economies in the world and the rest of the world. China could use other commercial weapons like its currency and calls for boycotts of US products or even the sale of US debt but it would probably be a last resort while the two major powers want to reach a trade agreement and avoid a recession.
Index & components
The equities that make up the FTSE China 50 Index come from the universe of the most important stocks in the Chinese market.
The FTSE China 50 Index is composed of 50 constituents, so it is relatively diversified. The financial sector (banks and insurance companies), however, accounts for about 47% of the capitalization while Tencent and the China Construction Bank accounts for 9% of the index each.
China is the world's second largest economy behind the US with a GDP of about $ 13600bn in 2017, the world's largest exporter with the world's largest foreign exchange reserves. The global recession of 2009 interrupted China's continued growth momentum, and the limits of its export-oriented growth model emerged. As a result of the global economic downturn and declining trade, Chinese growth decelerated to below 7% in 2015, its lowest level in 25 years. However, in 2017, growth reached 6.9% of GDP, an improvement over 2016 (6.7%).
State-owned enterprise debt accounts for 145% of GDP while private sector debt accounts for more than 200% of GDP. In addition, the quality of bank assets has deteriorated for several years and this trend is probably underestimated because of the importance of shadow banking. Many challenges remain linked to the problem of an aging population, the lack of openness of the political system, the competitiveness of an economy dependent on high investment expenditure and the expansion of credit. The manufacturing and construction sectors contribute nearly half of China's GDP, but the country is increasingly relying on services and domestic consumption.
China has set a new growth target for 2018 of around 6.5%, which means a gradual soft landing linked to the new growth model, more based on quality, corresponding to an upscaling of industry and services, but also focused on reducing the current major imbalances (too high debt, overcapacity in industry and real estate). China no longer seems to be in the race for growth, but in search of a more balanced and sustainable model based on the upscaling of its industry through technology and the expansion of services and domestic consumption.
China faces geopolitical problems with most of its neighbors (India, Japan ...) and especially in the China Sea, because of its plans for territorial expansion that could lead to military confrontations. Its confrontation with the USA, at the commercial level, could be amplified after D.Trump protectionnist actions.
Monthly data
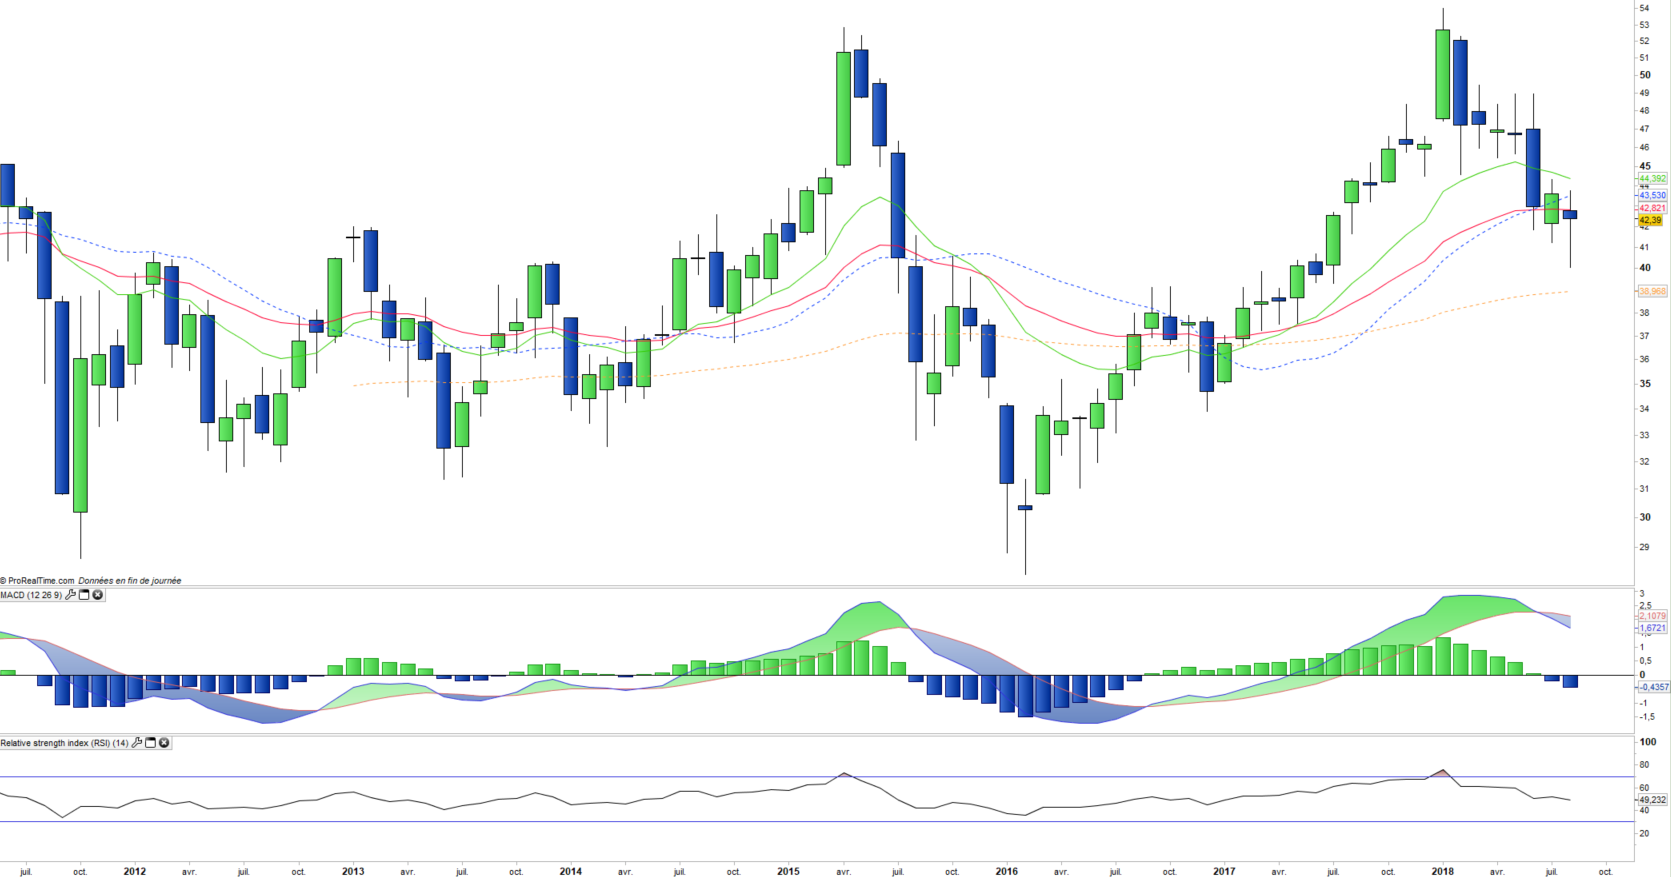
The analysis of the monthly charts shows a strong correction in progress, but which seems to slow down as the EMA100 approaches. The candlestick of August shows a stabilization that could give way to a rebound in the coming weeks. On the other hand, a bearish breakout of the EMA100 would be worrying and would install the index in a long-term downward trend.
Weekly data
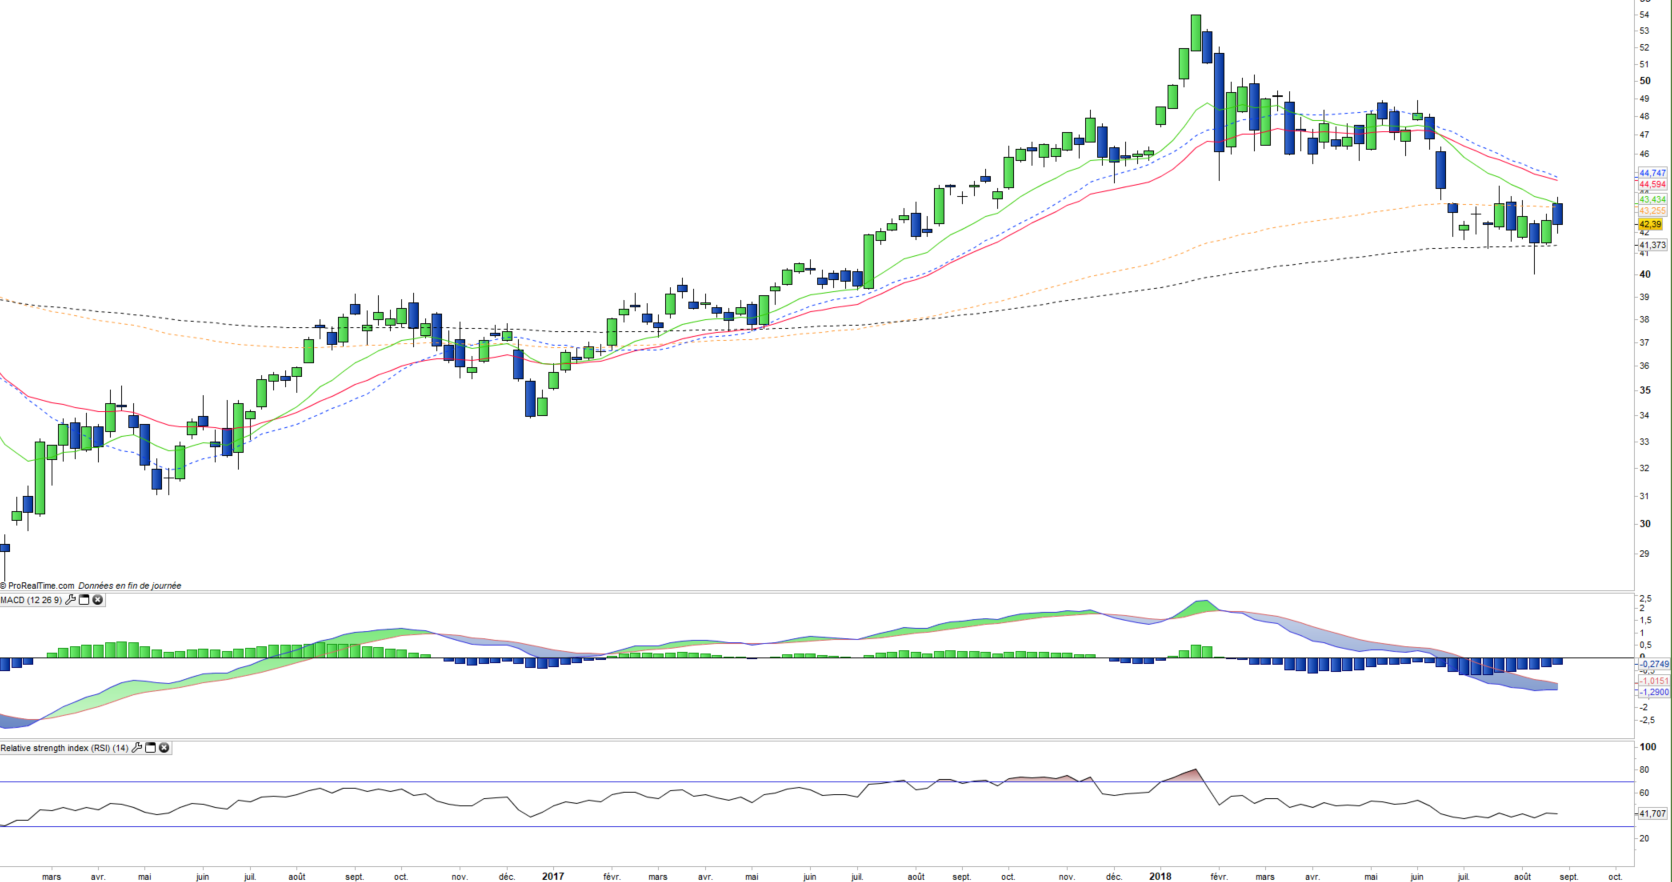
The weekly chart analysis shows the current rebound attempt after a deep correction started at the beginning of the year. Prices are currently stuck between the EMA100 and the EMA200 and the exit direction of this range should condition the medium-term trend. Oscillators and moving averages are bearish but the index has been hesitant since the beginning of the summer. The exit of this very narrow range is to be monitored carefully.
ETF Objective
FXI is an ETF listed in USD, which seeks to replicate the FTSE China 50 (50 chinese companies)
Characteristics
| Inception date | 05/10/2004 |
| Expense ratio | 0,74% |
| Benchmark | FTSE China 50 |
| Code / Ticker | FXI |
| ISIN | US4642871846 |
| UCITS | No |
| Issuer | iShares |
| Currency | $ |
| Exchange | NYSE Arca |
| Assets under Management | 4 728 M$ |
| Dividend | distribution |
| Currency risk | Yes |
| Number of Holdings | 50 |
| Risk | 4/5 |
Country Breakdown
| China | 100% |
Sector Breakdown
| Financials | 47% |
| Energy | 13% |
| Information Technology | 11% |
| Real Estate | 9% |
| Telecom | 9% |
| Industrials | 5% |
| Others | 6% |
Top Ten Holdings
| China Construction Bank | 9% |
| Tencent Holdings | 8% |
| Industrial & Commercial Bank | 8% |
| Ping an Insurance | 6% |
| China Mobile | 6% |
| Bank of China | 4% |
| Cnooc | 4% |
| China Petroleum & Chemical | 4% |
| China Life Insurance | 3% |
| Petrochina Ltd | 3% |