iShares China large cap ETF (FXI) - 16/07/2018
Short Term score: Negative (10%) / Trend =
Long Term strategy: Neutral (50%) / Trend -
Characteristics of the ETF
The FXI ETF (iShares) created in 10/2004 is listed in US dollar on the NYSE and replicates the FTSE China 50 Index which is composed of the main Chinese stocks listed in Hong Kong and composed for more than half of the capitalization of financial values. These shares are subject to the Chinese regulation but denominated in Hong Kong dollar (HKD). Chinese H shares, unlike A shares, are available to non-resident investors in China.
The fees of this ETF are 0.74% for AUM of $ 4055M. The replication method is physical and there is a semi-annual dividend distribution policy.
Alternative ETFs: CSIA (Lyxor in Euro), CC1 (Lyxor in Euro)
Latest developments
After a 33% increase in 2017, FXI is down -7.5% in 2018.
After very good economic figures at the end of 2017 and early 2018, which has been confirmed by the results of business, China is now in full quarrel with the Trump administration on trade, after spectacular announcements of rising tariffs by the US, first $ 50bn that have already entered into force, then 200md $ which must be added late August. China has announced that it will retaliate without further details. Chinese patience is likely to last until the November intermediate elections, then the trade dispute will result in a trade agreement between the two major powers otherwise the situation could become tougher with a potentially very negative impact on global growth. China could later use the monetary weapon (devaluation of the Yuan), the sale of US bonds or the organization of boycotts of some US products. However, it is not in China's interest to inflame the situation when its banking system is facing the accumulation of impaired loans. The most likely is that the two major powers reach an agreement in 2019, which will be necessary also to D. Trump for re-election.
Index & components
The equities that make up the FTSE China 50 Index come from the universe of the most important stocks in the Chinese market.
The FTSE China 50 Index is composed of 50 constituents, so it is relatively diversified. The financial sector (banks and insurance companies), however, accounts for about 46% of the capitalization while Tencent and the China Construction Bank accounts for 9% of the index each. China is the world's second largest economy behind the US with a GDP of about $ 13600bn in 2017, the world's largest exporter with the world's largest foreign exchange reserves.
The global recession of 2009 interrupted China's continued growth momentum, and the limits of its export-oriented growth model emerged. As a result of the global economic downturn and declining trade, Chinese growth decelerated to below 7% in 2015, its lowest level in 25 years. However, in 2017, growth reached 6.9% of GDP, an improvement over 2016 (6.7%). State-owned enterprise debt accounts for 145% of GDP while private sector debt accounts for more than 200% of GDP. In addition, the quality of bank assets has deteriorated for several years and this trend is probably underestimated because of the importance of shadow banking.
Many challenges remain linked to the problem of an aging population, the lack of openness of the political system, the competitiveness of an economy dependent on high investment expenditure and the expansion of credit. The manufacturing and construction sectors contribute nearly half of China's GDP, but the country is increasingly relying on services and domestic consumption.
China has set a new growth target for 2018 of around 6.5%, which means a gradual soft landing linked to the new growth model, more based on quality, corresponding to an upscaling of industry and services, but also focused on reducing the current major imbalances (too high debt, overcapacity in industry and real estate). China no longer seems to be in the race for growth, but in search of a more balanced and sustainable model based on the upscaling of its industry through technology and the expansion of services and domestic consumption.
China faces geopolitical problems with most of its neighbors (India, Japan ...) and especially in the China Sea, because of its plans for territorial expansion that could lead to military confrontations. Its confrontation with the USA, at the commercial level, could be amplified after D.Trump protectionnist actions.
Monthly data
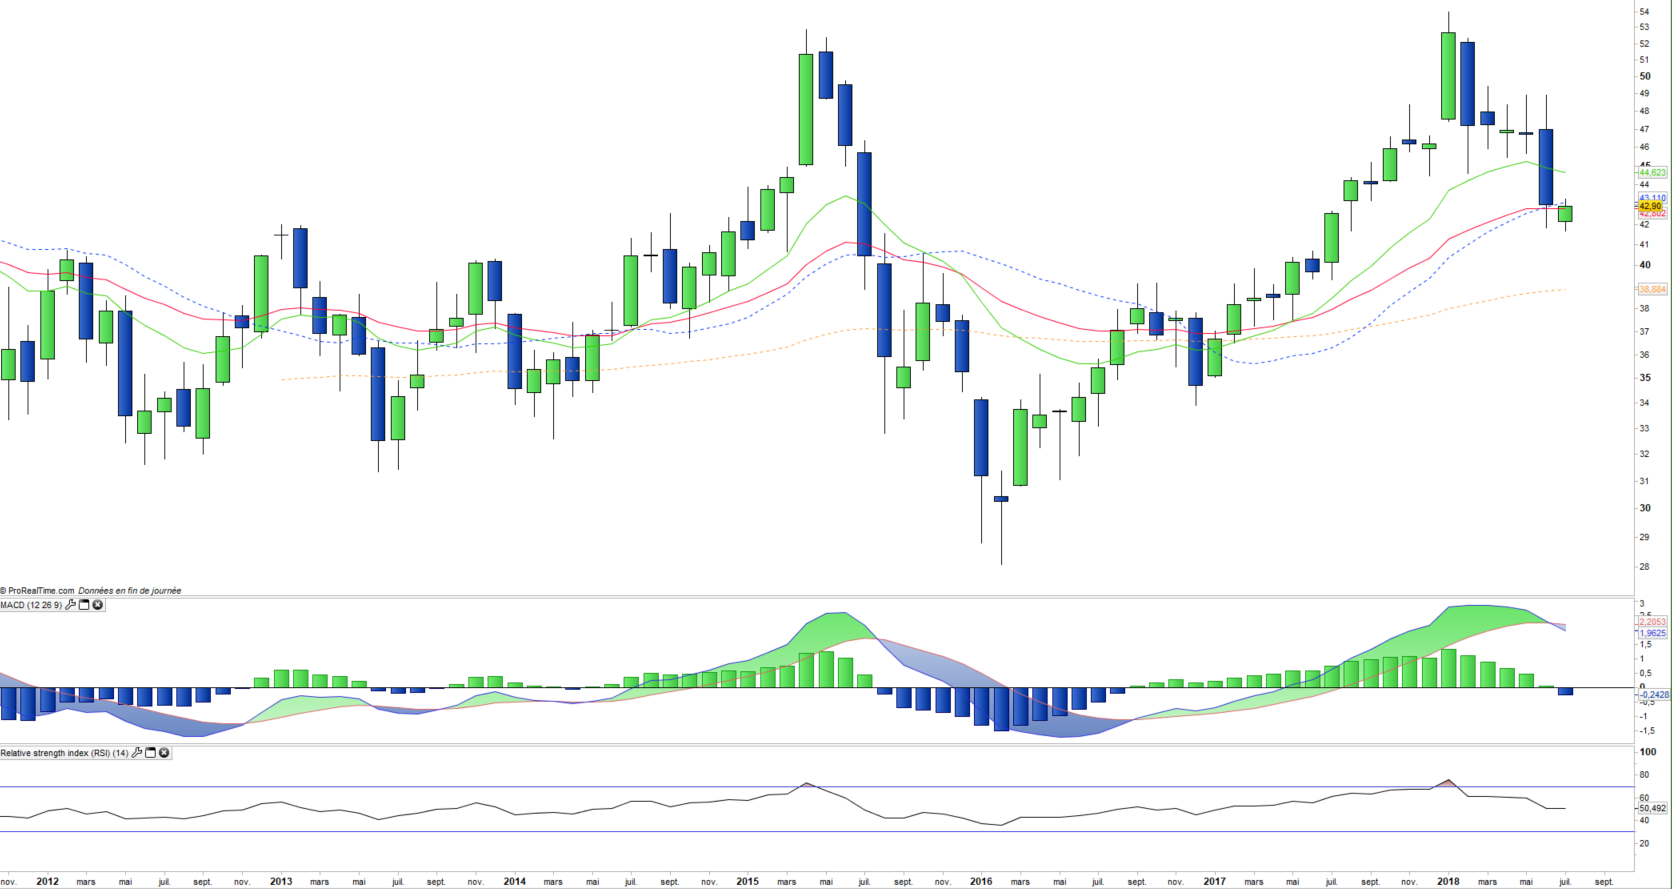
The analysis of the monthly charts shows a new deep correction, which threatens to return once again to the EMA100 support line around $ 39. This configuration is similar to that of 2016, with a bullish start of a few months followed by a sudden reversal and a complete erasure of the rise. Prices traded below main moving averages and broke the bullish trend, while the MACD also crosses lower. The next credible support is the EMA100.
Weekly data
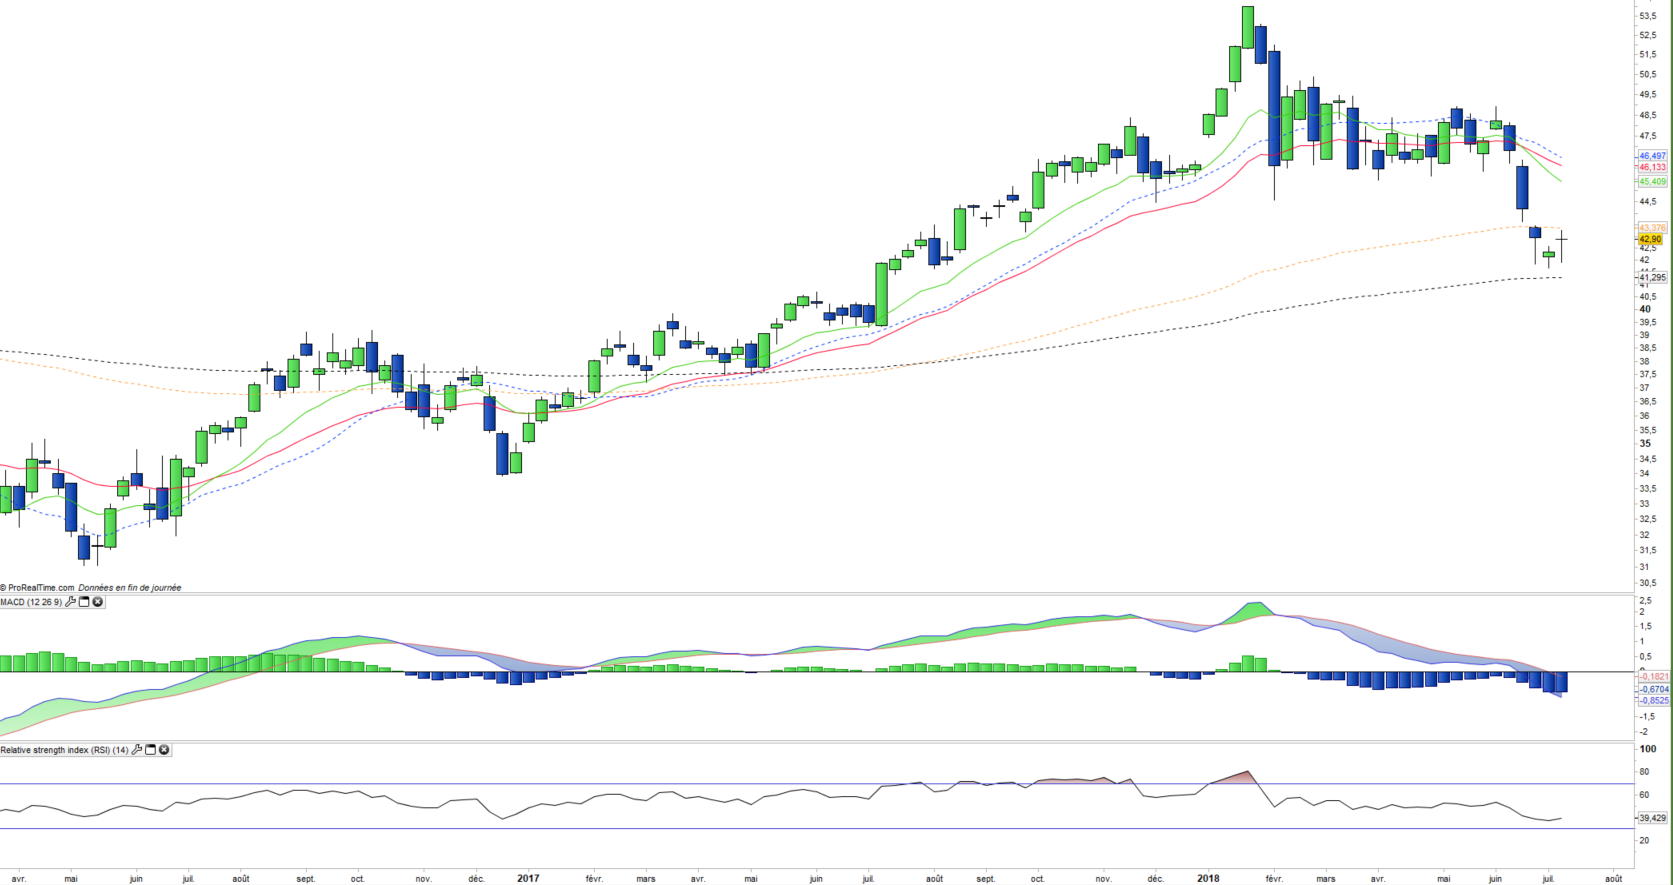
The daily chart analysis shows a downward shift in the medium-term trend, resulting in the crossover of EMA13 and 26 and the downward crossing of the zero line by the MACD. However prices are in a support zone with the EMA200 that could cause a technical rebound, but the overall configuration has become bearish.
ETF Objective
FXI is an ETF listed in USD, which seeks to replicate the FTSE China 50 index (50 chinese companies)
Characteristics
| Inception date | 05/10/2004 |
| Expense ratio | 0,74% |
| Benchmark | FTSE China 50 |
| Code / Ticker | FXI |
| ISIN | US4642871846 |
| UCITS | No |
| Issuer | iShares |
| Currency | $ |
| Exchange | NYSE Arca |
| Assets Under Management | 4 055 M$ |
| Dividend | Distribution |
| Currency Risk | Yes |
| Number of Holdings | 50 |
| Risk | 4/5 |
Country Breakdown
| China | 100% |
Sector Breakdown
| Financials | 46% |
| Energy | 12% |
| Information Technology | 11% |
| Real Estate | 9% |
| Telecom | 8% |
| Industrials | 4% |
| Others | 10% |
Top Ten Holdings
| China Construction Bank | 9% |
| Tencent Holdings | 9% |
| Industrial & Commercial Bank | 8% |
| Ping an Insurance | 5% |
| China Mobile | 5% |
| Bank of China | 4% |
| Cnooc | 4% |
| China Petroleum & Chemical | 4% |
| China Life Insurance | 3% |
| Petrochina Ltd | 3% |