The GDXJ ETF (Vaneck Vectors), created in 10/2009, replicates the MVIS Global Junior Miners Index, which is composed of the major international small caps on the gold and silver mining sector. This index is quite broad and includes 66 values on the 5 continents. This ETF is listed in USD on the NYSE and bears costs of 0.54% with an AUM of approximately $ 4.27Bn. The method of replication is direct and the distribution of dividends is annual.
Alternative ETFs: GDX ( vaneck, USD), RING ( iShares, USD), GOEX ( globalx, USD).
Index & components
The GDXJ ETF (Vaneck) offers investors access to a basket of 66 small caps that specialize in gold and silver mining with an average market capitalization of $ 1820M.
The top 10 stocks represent about 45% of the index's capitalization, so the specific risk is therefore rather low. This index is fairly focused, with a predominant share of gold and silver mining (which must represent at least 50% of the activity to be eligible for the index), and is therefore highly dependent on prices of these precious metals. The geography of these companies is 65% North American (more than 51% for Canada) while Australia (23%) and South Africa (14%) are also two important areas for this activity.
Small caps specialized in the mining of gold and silver are generally more sensitive to minerals, because of the investment they have to consent and their financial balances, sometimes more fragile than the large diversified companies. Operational leverage can also be very important in the event of a favorable trend on gold, which is often reinforced by M & A operations and investment acceleration.
Gold prices are very sensitive to monetary policy, as this mineral does not distribute interest or dividends. However, in the event of a slippage in inflation or, conversely, if a new crisis were to emerge on the horizon, gold remains the natural safe haven for investors.
Gold prices are far from their 2010/2011 highs, but they have stopped falling while elements of uncertainty accumulate, whether it is the confidence in the dollar following the erratic US policy or geopolitical tensions. At the same time, central banks continue to accumulate gold, which has not lost its appeal as a last resort asset.
GDXJ is an original way to play the rise of gold and silver, with a significant leverage linked to the size of the companies that make up this selection.
Latest developments
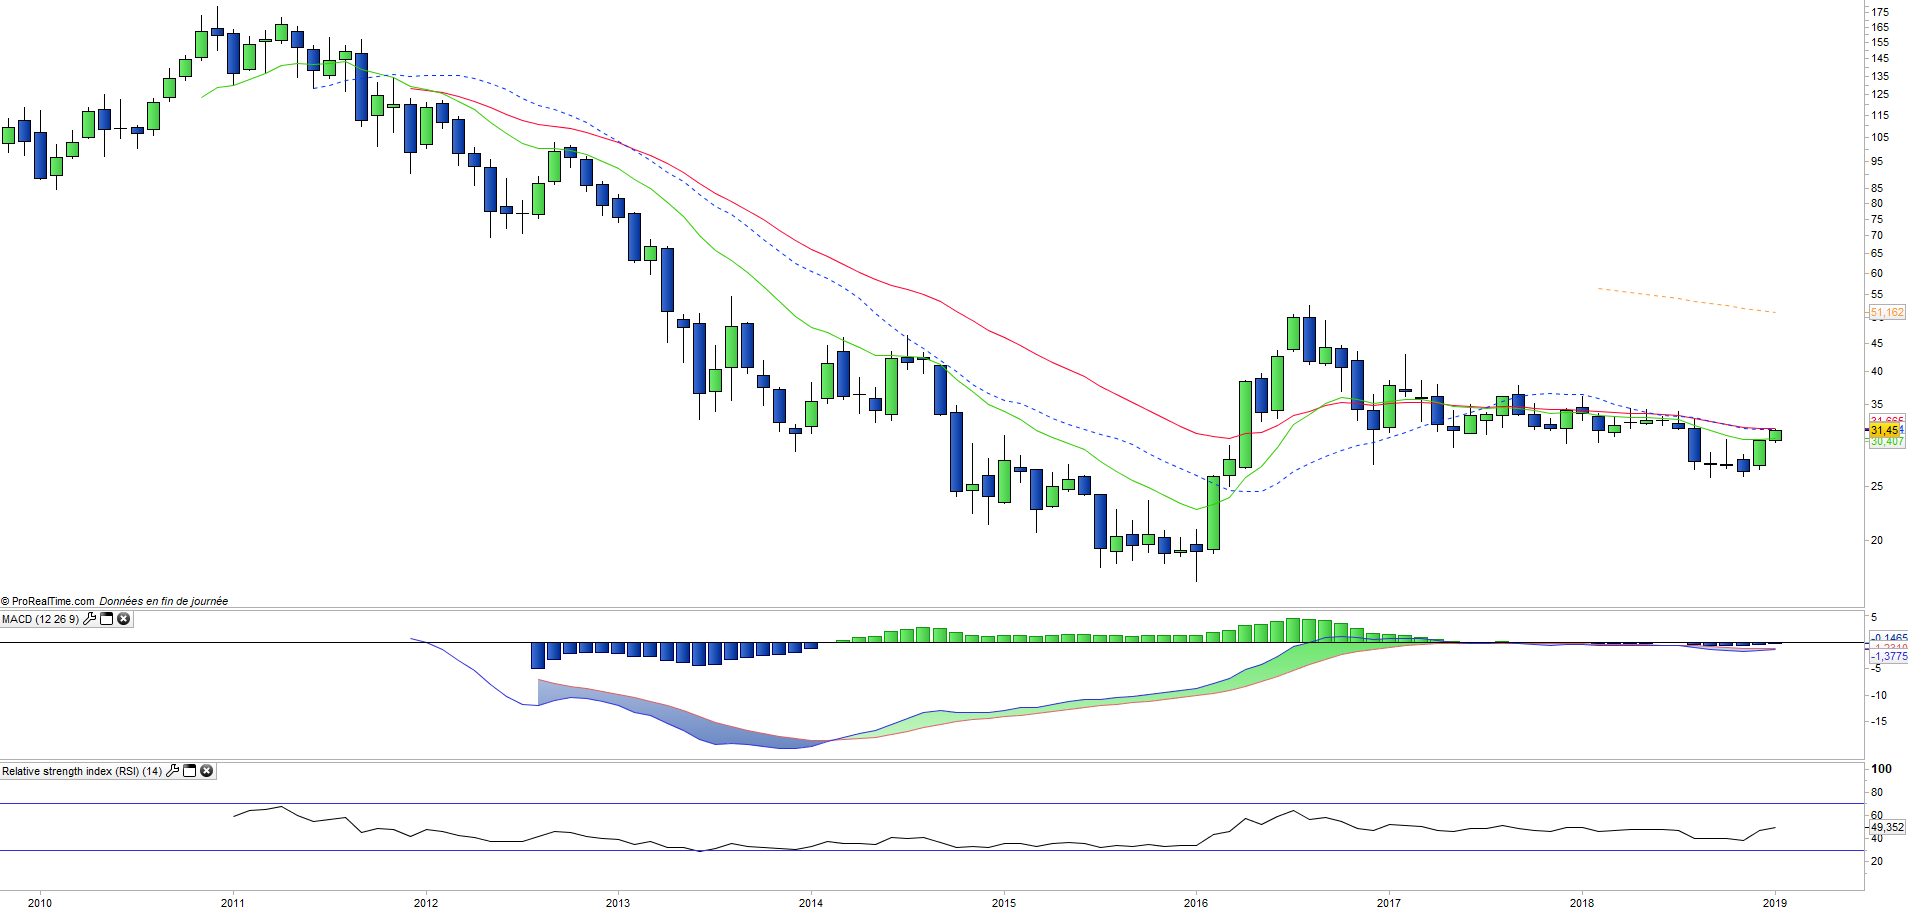
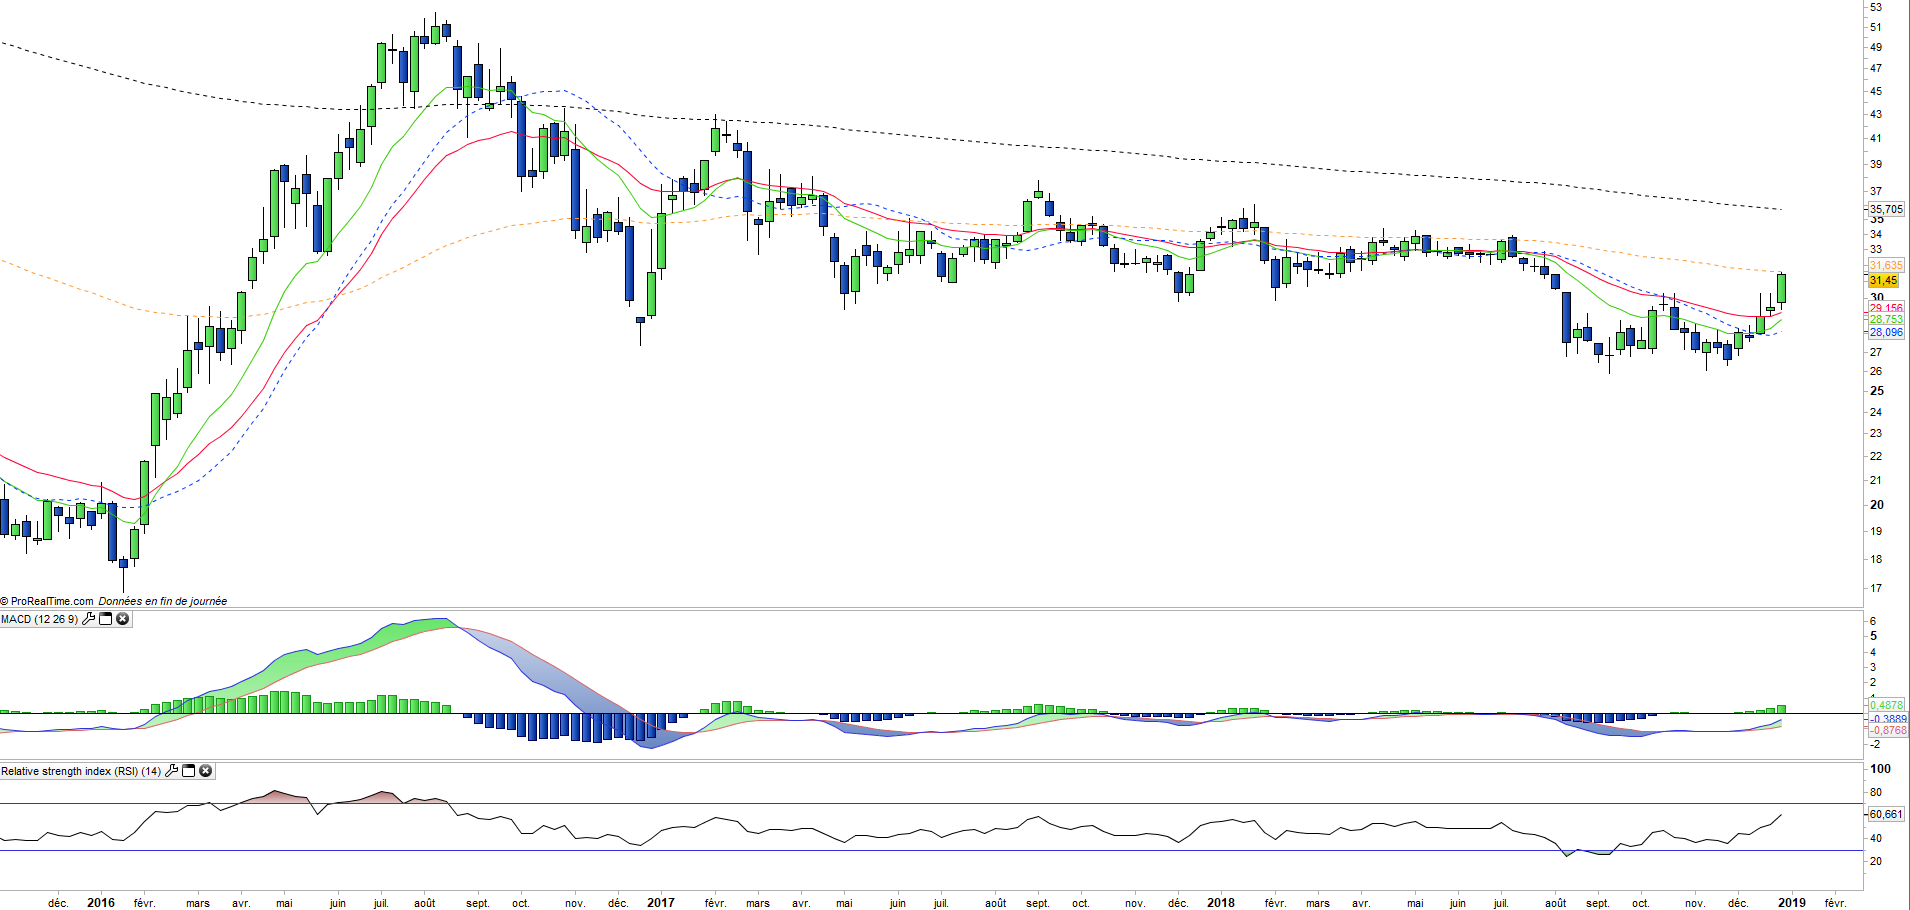
GDXJ declined by about 11% in 2018 due to the rise in US rates and the dollar while inflation expectations were revised upwards, but already bounced back by 4% in 2019.
Historically, GDXJ tends to amplify the movement of gold prices when it is really directional: + 55% in 2010 against + 29% for gold and -61% in 2013 against -28% for gold, which gives approximately a factor of 2x upwards and downwards.
Gold prices are currently rising because of fears of a US recession and the anticipation of a fall in interest rates by the end of 2019. Moreover, there is no real inflation, which is a favorable factor. the Trump administration undermines the investor's confidence in the dollar by calling into question the authority and independence of the Fed.
Significant geopolitical risks are supporting gold prices, particularly tensions with China that threaten to derail the global economy.