Amundi Global Luxury (GLUX) - 12/01/2018
Short Term Strategy : Positive (90%) / Trend =
Long Term strategy : Positive (100%) / Trend =
Characteristics of the ETF
The GLUX (Amundi) tracker replicates the S&P Global Luxury Index, which is made up of the 80 largest international luxury goods and services companies. Note that the GLUX benchmark is quoted in USD. The ETF is quoted in Euro, but bears multiple currency effects given its geographical distribution. Despite its seniority (2008), the actual history of GLUX is brief because until February 2014 this ETF replicated the MSCI Insurance index.
The costs of this ETF are low (0.25%), in particular for a thematic tracker and the AUM are approximately € 124m. Replication is indirect (via a swap) and the dividend method is capitalized. The tracking error of this ETF is very low (0.09% in 3 years).
Alternative ETFs: VCR (Vanguard USD), DC6 (Amundi)
Index & components
This index is rather broad, which is reinforced by the diversity of its sub-sectors. Of the c.52% that weigh the top 10 capitalizations, the luxury automobile (Daimler, BMW, Tesla) represents c.15%, spirits (Diageo, Pernod Ricard) c.12% and luxury (LVMH, Richemont) c.12%. But GLUX also gives investors access to sectors such as luxury cruises (Carnival), clothing (Nike) and even casinos and luxury hotels (Las Vegas Sands).
All these companies share the common trait of being world leaders, with strong brands, generating high margins and regularly delivering growth levels well above the global GDP. They are more or less cyclical depending on the compartments - very cyclical for the auto part and hotels, not very cyclical for spirits - but have one thing in common, which is an important exposure to Asia and first of all China, while emerging countries become the main outlet, so India Brazil and Russia are gradually gaining importance.
The geographic distribution of GLUX makes it a good diversification tool on the theme of luxury. Europe accounts for almost 50% of the capitalization of the index, followed by the United States (38%). But Asia is also represented: Hong Kong, Japan and Korea together account for nearly 10%. Australia closes the market with 2%. GLUX has delivered a regular positive performance (8.5% in 2014, 4.7% in 2015 and 1.7% in 2016).
This index can be volatile, as evidenced by the sharp correction between April 2015 and February 2016 (-28%) slightly higher than that of the index stoxx600 (-26%), but it is above all a growth theme related to the development of emerging economies, primarily Asian ones.
Latest developments
GLUX recorded an increase of 22.2% in 2017, more than twice the performance of the Stoxx600NR (10.6%) mainly thanks to the luxury engine while the car that was penalized in the first part of the year due to a weaker US market and scandals on diesel, then accelerated in the second half thanks to a very dynamic European market and a sustained Chinese growth.
Growth in Chinese consumption has been the mainstay of the luxury sector, regardless of sub-segments including spirits (Pernod, Diageo and LVMH).
The automotive sector appears to be the most at risk in 2018, due to uncertainties in the US (at the top of the cycle) and China due to fierce local competition and consumer dynamics that could be more constrained. The luxury sector should continue to benefit global growth prospects of nearly 4% in 2018, which are well balanced across geographical areas. One of the main challenges facing the sector is in emerging countries, which represent the greatest potential in the medium term.
In the short term, the main risk is probably a monetary tightening of the FED which would penalize emerging countries and threaten the global growth cycle.
Monthly data
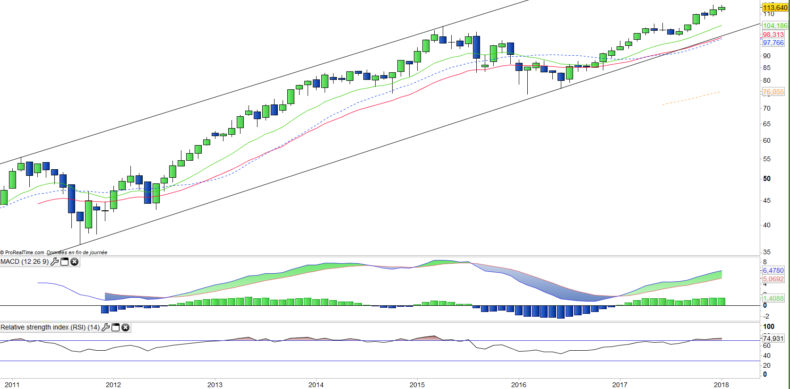
The monthly chart shows a long-term bullish trend but does not show any particular runaway. The upward phase that started at the end of 2016 still has potential, which is confirmed by the level of oscillators, still far from the overbought levels reached in 2015.
There is no particular excess, either at the size of candlesticks or distance to moving averages. This trend therefore appears to be very solid.
Weekly data
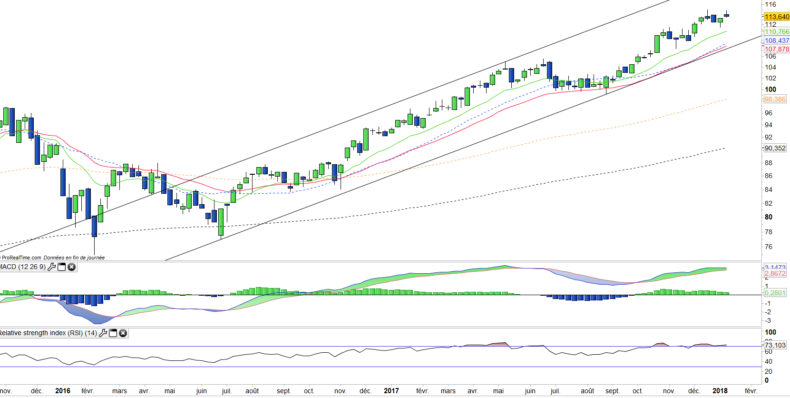
On the weekly chart, we can see an uptrend with a fairly steep slope and rising moving averages that indicate no sign of weakness.
The crossings of the MACD have so far yielded rather predictive signals of the trend. This indicator will be closely monitored and remains very well oriented for the moment.
ETF Objective
GLUX is a UCITS ETF which replicates the S&P Global Luxury (80 companies).
Characteristics
| Inception date | 09/12/2008 |
| Expense ratio | 0,25% |
| Benchmark | Indice S&P Global Luxury |
| Ticker | GLUX |
| Issuer | Amundi |
| UCITS | Yes |
| EU-SD Status | Out of scope |
| Currency | € |
| Exchange | Euronext Paris |
| Assets Under Management | 123 M€ |
| Dividend | Capitalization |
| PEA (France) | Yes |
| SRD (France) | No |
| Currency risk | Yes |
| Number of Holdings | 80 |
| Global Risk | 3/5 |
Country Breakdown
| USA | 38% |
| France | 16% |
| Germany | 13% |
| United Kingdom | 11% |
| Switzerland | 6% |
| Hong Kong | 5% |
| Others | 11% |
Sector Breakdown
| Consumer discretionary | 80% |
| Consumer staples | 20% |
Top Ten Holdings
| Diageo | 9% |
| Daimler AG | 8% |
| LVMH | 8% |
| Nike | 7% |
| Richemont | 4% |
| Tesla Motors | 4% |
| Pernod Ricard | 3% |
| BMW | 3% |
| Kering | 3% |
| Estée Lauder | 3% |


