The HSI ETF (Lyxor) created in 09/2006 quoted in Euro on Euronext and replicates the index Hang Seng Index Net Total Return Index whose 50 components are selected according to the level of their liquidity and their market capitalization. They come from the main economic sectors and represent around 70% of the capitalization of the eligible securities listed on the first section of the Hong Kong Stock Exchange (SEHK). The securities comprising the index are H-shares as well as foreign stocks, particularly British ones.
The fee of this ETF is 0.65% for an AUM of € 158M. The replication method is indirect (via swap) and there is a semi-annual dividend distribution policy.
Alternative ETFs: EWH (iShares in USD)
Latest developments
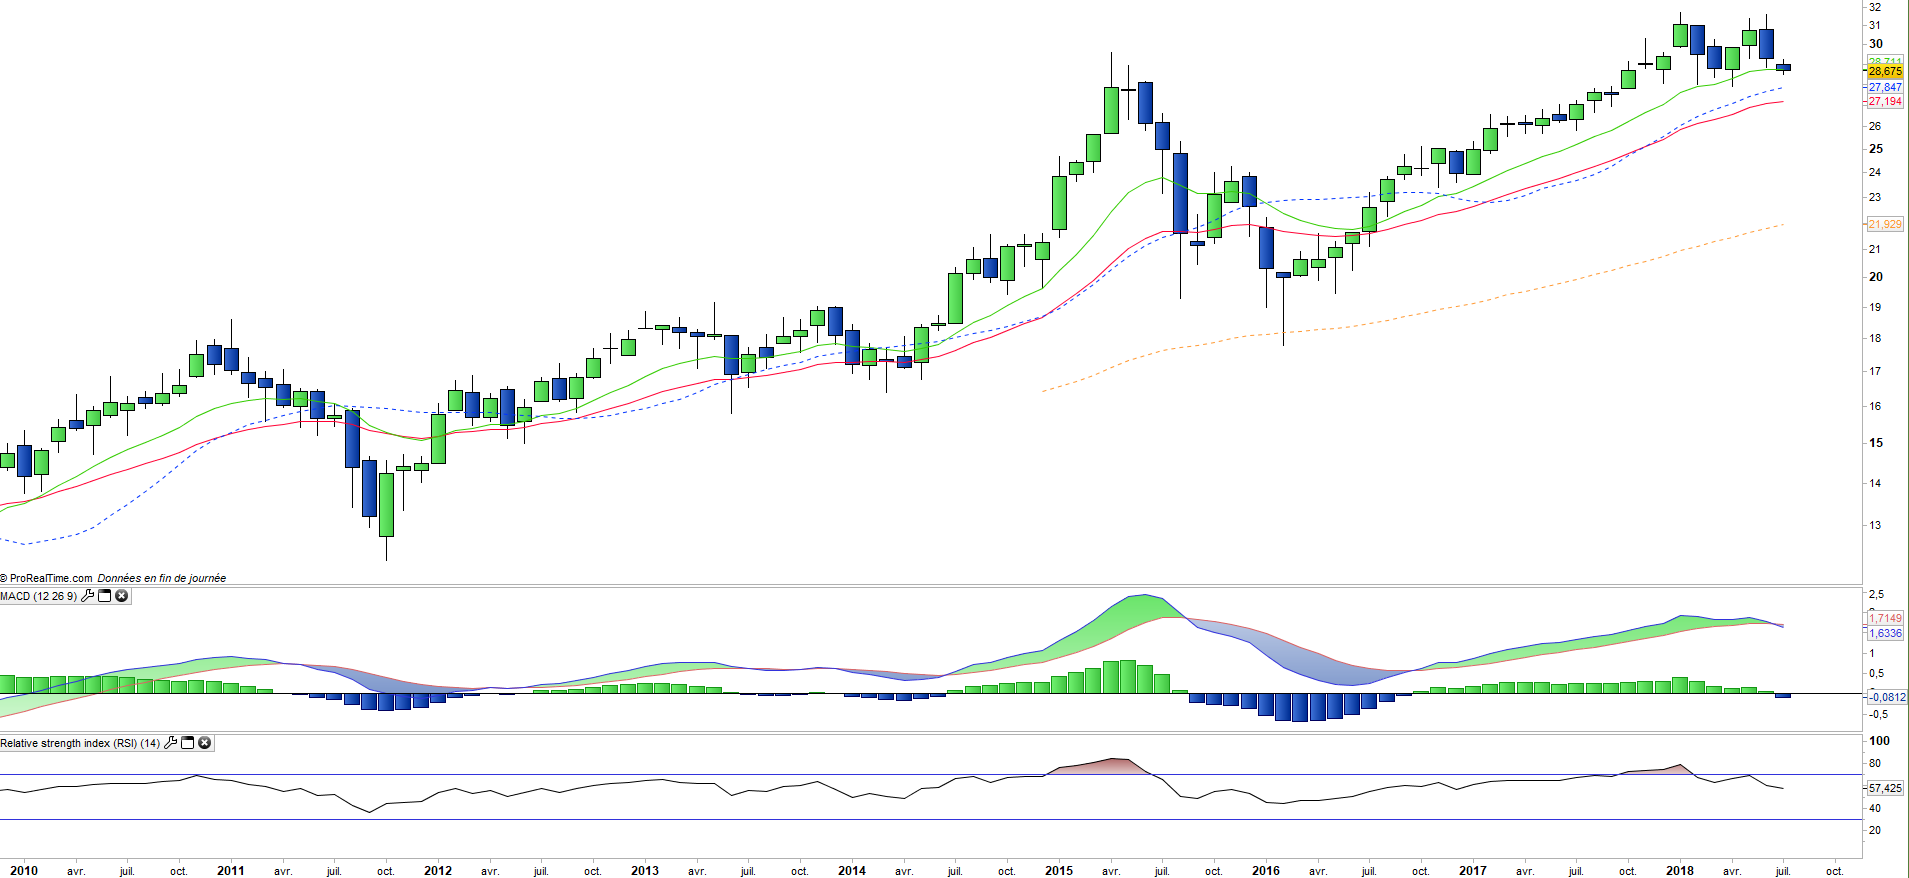
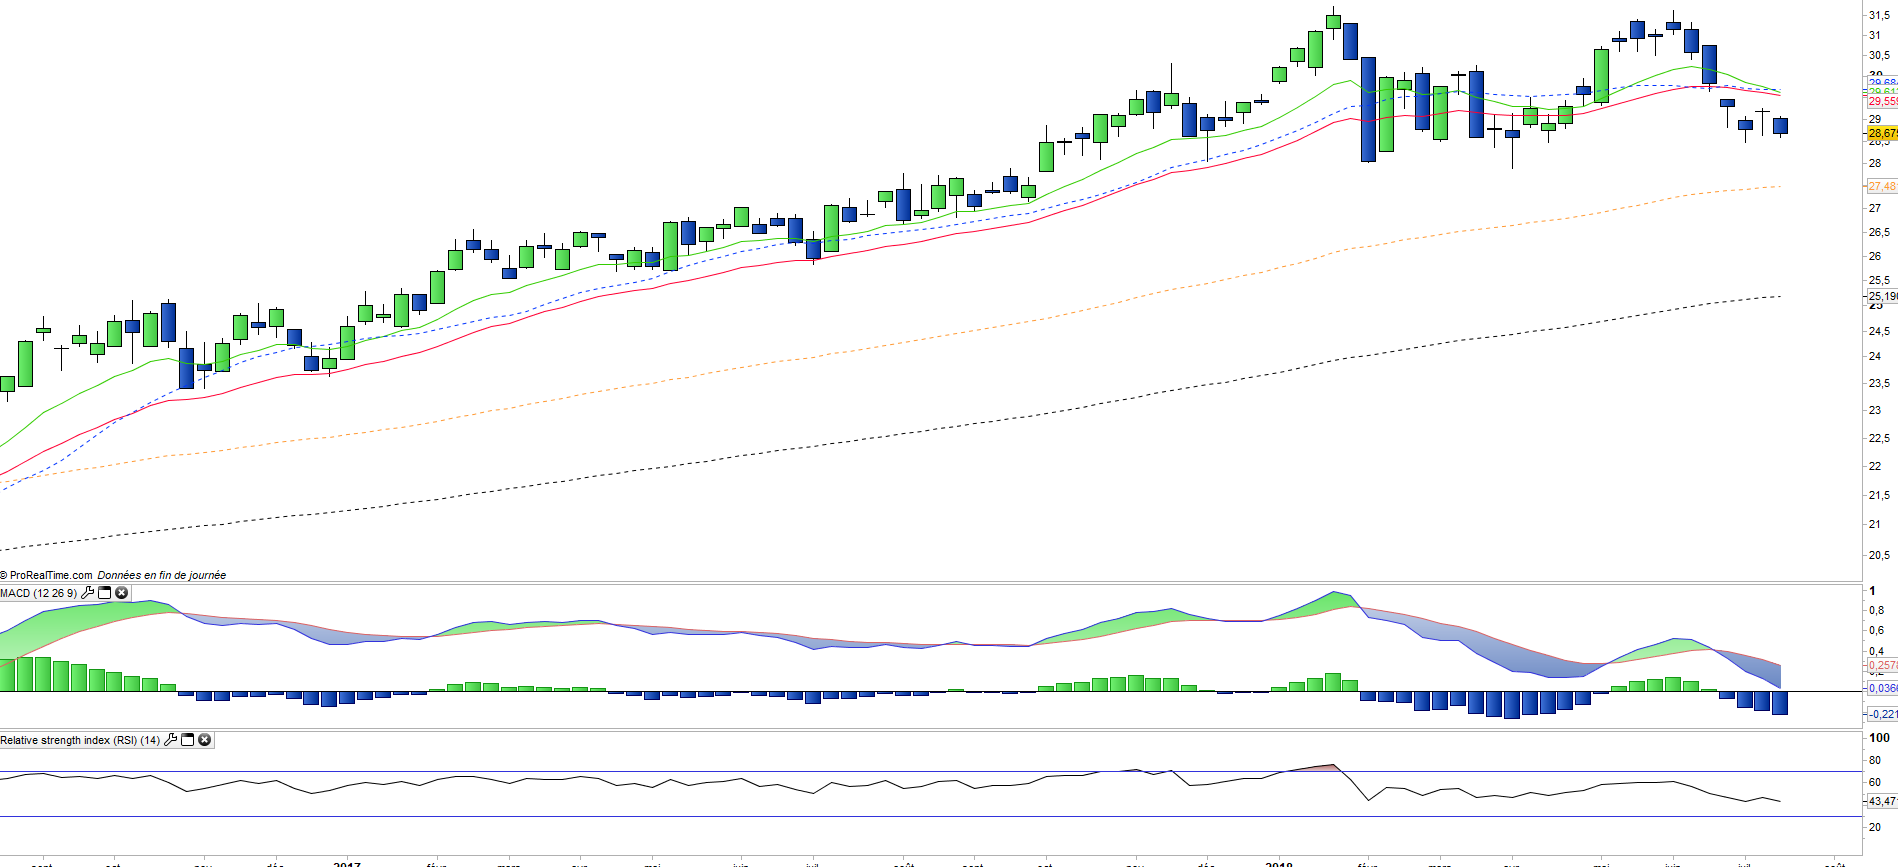
After a 22.6% increase in 2017, HSI is down -1.8% in 2018. Hong Kong benefited in 2017 from the very good momentum of the world economy and at the beginning of 2018 the strong growth of the Chinese economy.
However, D. Trump's protectionist actions put the export-based economy and financial services at risk. Hong Kong is very sensitive to global trade, and financial crises as in 2008, which is linked to the heavy weighting of the financial sector. HSBC's initial capitalization of the index is a bit like Hong Kong, global, financial and at the same time profoundly Asian. The HK index is often a leading indicator compared to other regional indices.
Index & components
The shares in the Hang Seng Index Index come from the universe of the most important stocks in the Chinese market as well as large British stocks like HSBC, the first capitalization with 10% of the index which is composed of 50 constituents, and is therefore relatively diverse.
The financial sector (banks and insurance), however, represents around 47% of the capitalization while Tencent represents 10% and AIA Group (insurance company) about 9% of the index. Real estate and Technology each represent 12% of the composition.
Despite its return to China, Hong Kong has an international culture and export-oriented, 50% to mainland China, it is the world's third largest financial center. With its 7 million inhabitants, Hong-Kong retains some of its specificities but its economy is more than ever linked to China, which accounts for 75% of local tourism, and remains the second largest economy in the world behind the US with GDP of about $ 13600bn in 2017, the world's largest exporter and holds the world's first foreign exchange reserves.
China has set a new growth target for 2018 of around 6.5%, which means a gradual soft landing linked to the new growth model, more based on quality, corresponding to an upscaling of industry and services. but also focused on reducing the current major imbalances (debt too high, overcapacity in industry and real estate).
China no longer seems in a race for unbridled growth, but in search of a more balanced and sustainable model based on the upscaling of its industry through technology and the expansion of services and domestic consumption. Hong Kong is therefore perfectly in line with the Chinese strategy and is rather an economic model to follow but which must be controlled politically. China faces geopolitical problems with most of its neighbors, especially in the China Sea, because of its plans for territorial expansion that could lead to military confrontations. His confrontation with the US, at the commercial level, could increase after the protectionist actions of D.Trump which would inevitably weigh on Hong Kong.