The IEO ETF (Ishares-BlackRock) replicates the Dow Jones Index based on a selection of US stocks specializing in oil and gas exploration and production.
It is a very focused index, from a geographical point of view consisting primarily of US stocks and quoted in USD, but also from a business perspective with 77% of exploration & Production, and for the rest of the refining and transportation companies. Moreover, we consider that the index is rather well diversified with 54 stocks.
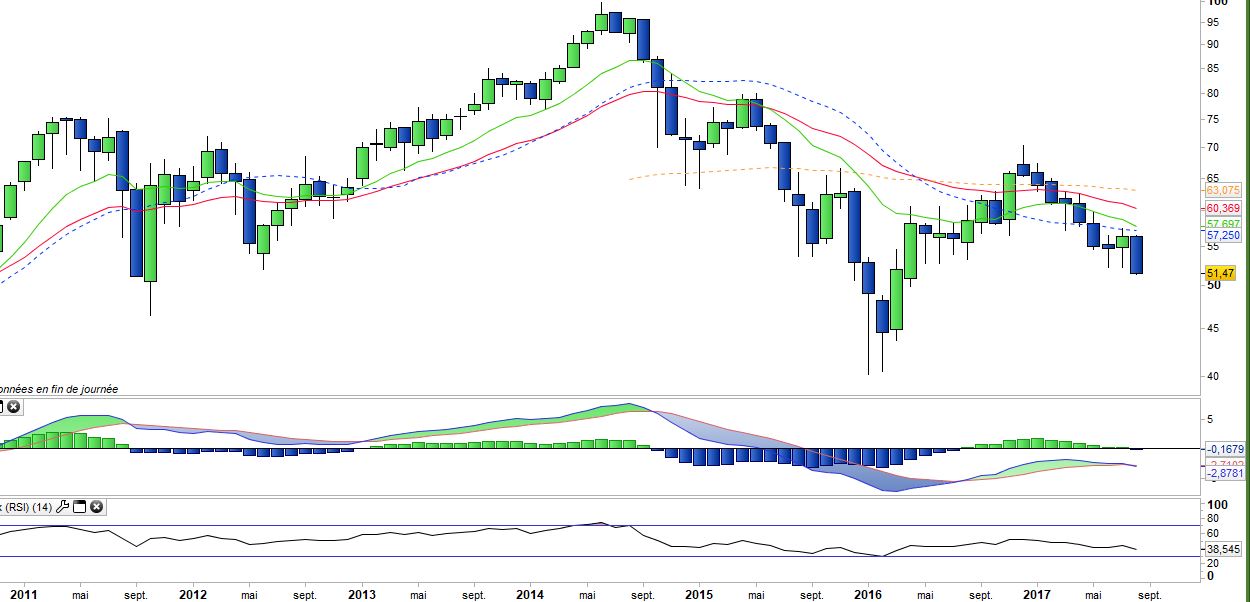
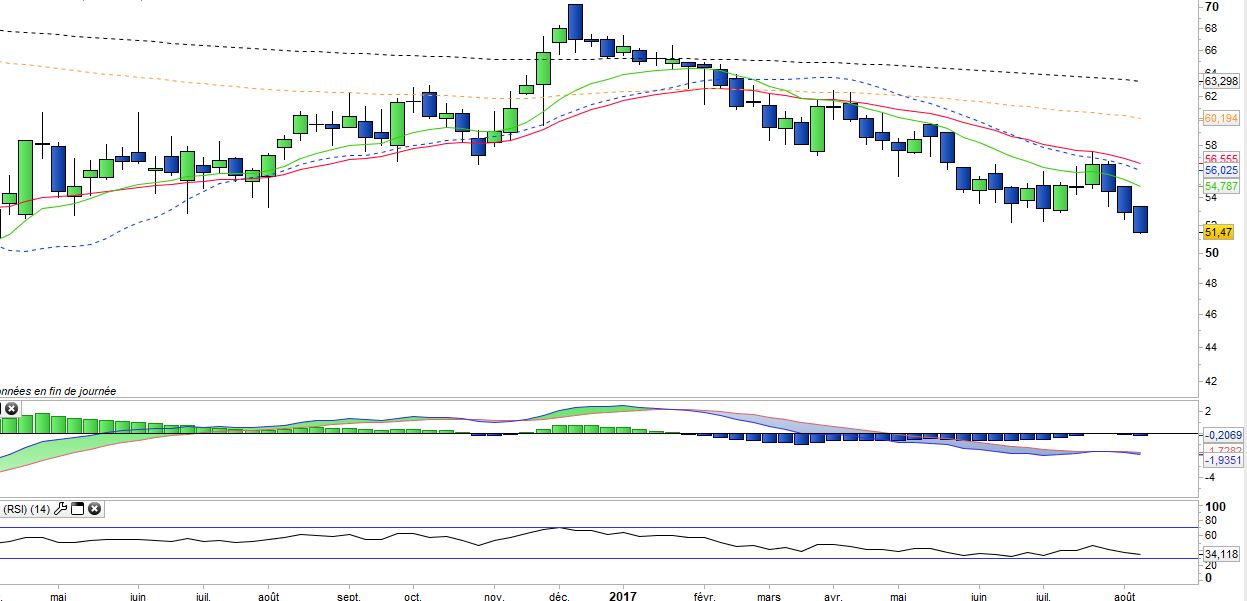
The ETF was launched in 2006 and has experienced high volatility, correlated with dramatic changes in the oil price: in June 2014, the ETF reached a peak of $ 100 before relapsing around $ 40 at the start of 2016 in the wake of the crude sell-off. This is a very volatile and risky index. However, since its inception in 2006 the ETF has posted a cumulative positive performance of about 20% which is better than the evolution of the barrel.
The main components of the index include players in the exploration and production of shale gas and oil, such as EOG, Concho or Pioneer, who benefit from a much lower cost base than so-called conventional oil companies, as well as greater flexibility and adaptability to crude oil prices. We consider that the price of oil is expected to fluctuate between $ 40 and $ 70 in the coming years as a result of a gradual increase in demand and a lower supply resulting from the stoppage of investments over the past two years in the wake of the lower prices.
Unconventional exploration / production companies are expected to outperform in the context of oil prices over $50, due to their lower cost base. However, the importance of shale production (of the order of 1 million barrels / day according to certain sources) is likely to limit the bullish potential.
In the longer term, the electric car and the current innovations in renewable energies (grids) could be a powerful deflationary effect on the oil price, while the energy component in GDP growth is decreasing due to the increase in the share of services (notably in China and India).
The 0.44% fee is slightly above average, but remains affordable for such a specialized index, while liquidity amounts to c.$348M.
We consider this ETF to be very qualitative in view of the limited tracking error. The only short-term catalyst for the upward trend, the OPEC (and Russia) agreements on the reduction of production have so far had no effect on crude oil prices, except for a stabilization around the $ 50, but further cuts could occur later on this year.