iShares US Oil & Gas Expl. & Production (IEO) - 26/06/2018
Short Term strategy: Positive (60%) / Trend -
Long Term strategy: Positive (100%) / Trend =
Characteristics of the ETF
The IEO ETF (Ishares) created in 05/2006 and listed on the Nyse in USD, reproduces an index based on a selection of 67 stocks specialized in the exploration and production of oil and gas. The tracked index is the Dow Jones U.S. Select Oil Exploration & Production Index. This is a very specialized index from a geographical point of view, composed mainly of US stocks and quoted in USD.
The fee for this ETF is 0.44% and the AUM is approximately $ 559M. The replication method is direct and there is a dividend distribution policy.
Alternative ETFs: XOP (SPDR in USD), PXE (Powershares in USD)
Index & components
The IEO ETF replicates a very specialized index from a geographical point of view, composed mainly of US stocks and quoted in USD, but also from a business point of view with 72% of specialists in exploration & production, and for the rest companies specializing in refining and transport.
In addition, we consider that the index is rather well diversified with 67 securities that make it up. This index has experienced high volatility, in correlation with oil prices variation: in June 2014, the ETF reached a peak of $ 100 before relapsing around $ 40 in early 2016 in the wake of the fall in oil prices.
This is a very volatile and risky index. However, since its creation in 2006 the ETF has a cumulative positive performance of about 37% which is better than the evolution of the oil price. The main components include actors specialized in the exploration and production of shale gas and shale oil such as EOG, Concho or Pioneer, which have a much lower cost base than the so-called conventional oil companies, as well as greater flexibility and adaptability to crude prices.
We believe that the oil should fluctuate between $ 60 and $ 80 in the coming months due to a gradual increase in demand and a lower supply resulting from the shutdown of investments for the last 3 years in the wake of the lower prices. Unconventional exploration / production companies are expected to outperform in the context of oil prices above $ 50, thanks to their lower cost base.
However, the importance of shale production (of the order of 1million barrels / day) is likely to limit the upside potential until 2019. In the long term the electric car and the ongoing innovations in renewable energies (grid) could be a powerful deflationary effect on oil prices, while the energy component of GDP growth is decreasing due to the increased share of services (notably in China and India).
We consider this ETF to be very qualitative given its small deviation in time from the benchmark. The outlook for 2018 is encouraging, while companies in the sector have sharply reduced their breakeven, their margins are at the bottom of the cycle, with a barrel that could rise in the next two years.
Latest developments
The performance of IEO in 2017 was -0.7% compared to 19.4% for the S & P500 but stood at + 10.5% since the beginning of the year.
The barrel remains firm around $ 68 (WTI) because of the strong global growth (4% in 2018) which should help balance the market, and the geopolitical factor in the Middle East after the exit of the United States from the nuclear deal with Iran, security problems in Libya and the scheduled bankruptcy of Venezuela that will soon be unable to run its oil wells. After drastic cuts in production, OPEC has just decided to reinject into the market about 600K barrels / day, thus gradually reducing its support for crude prices, while the rebalancing of the market is now effective.
In the structural factors, we must take into account the lack of investment in exploration / production for almost 4 years that cannot be fully met by shale oil whose rate of growth in production could find limits at the level of infrastructures like the supply of sands by trucks. By 2019, shale oil will no longer be able to offset demand, while without investment the production potential of existing wells is eroding by 5% per year. The market's potential for reappraisal of the sector seems significant in the medium term.
Monthly data
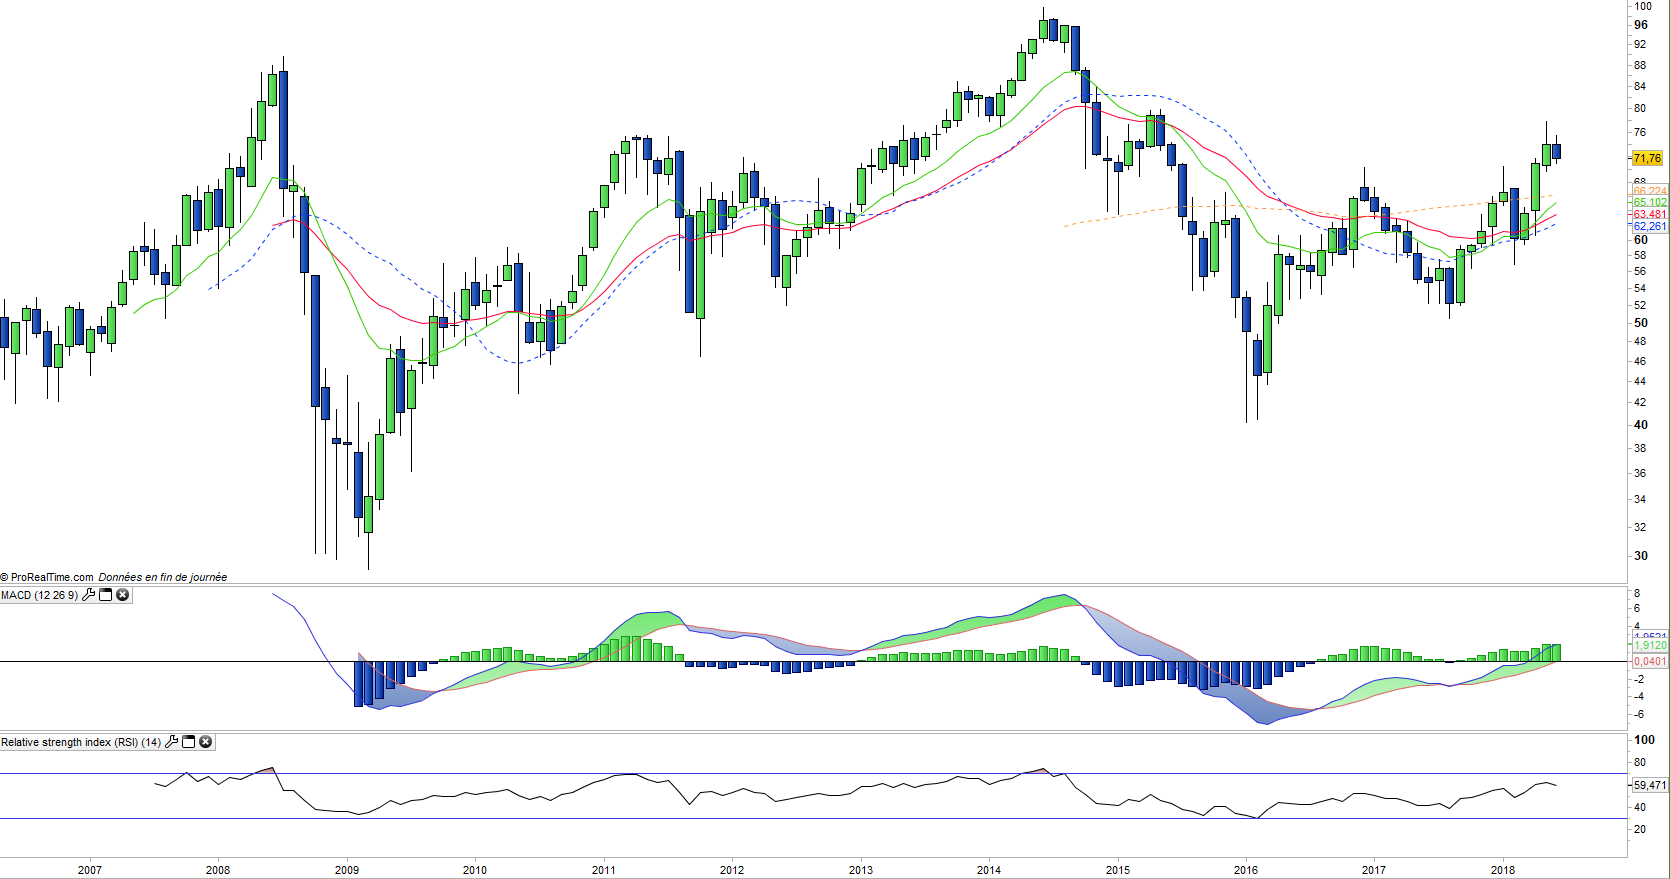
The monthly chart shows a long-term uptrend, which has just recorded 3 months of consecutive increase but which now seems to stall on the year highs. The candlestick that just appeared in June seems to announce a pullback towards moving averages, which appears necessary after a 20% increase and an overbought pattern. This pullback is primarily targeting the EMA13 around $ 65, before resuming the underlying trend.
Weekly data
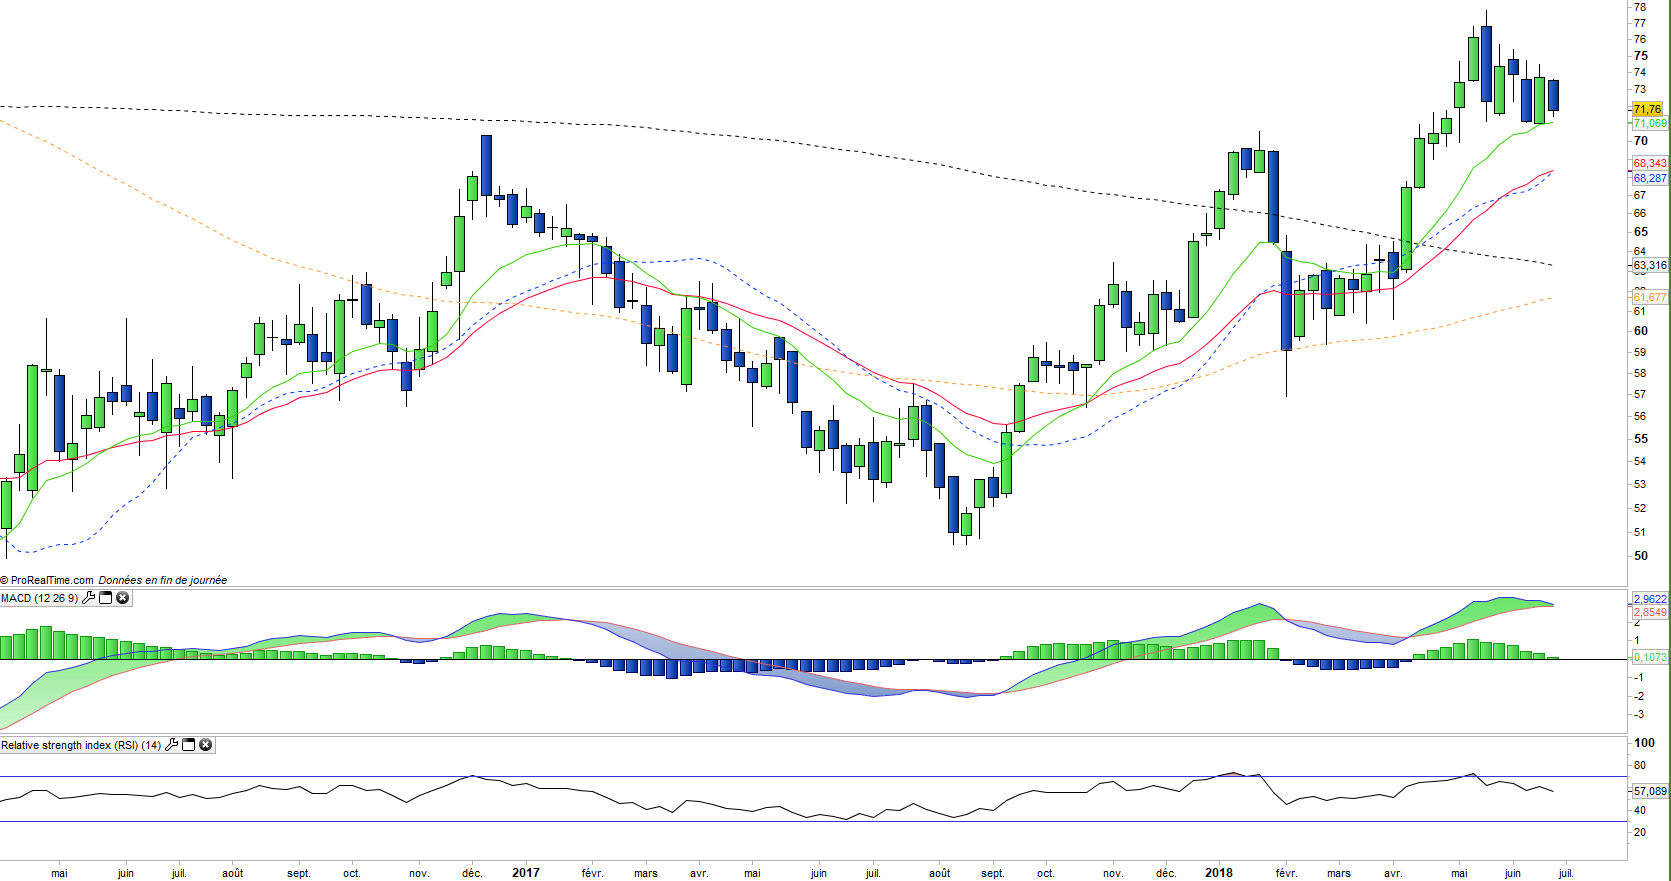
The weekly chart shows a bullish trend in the medium term, which has just returned to test the EMA13 level which should lead to a possible rebound and the continuation of the rise. However the technical oscillators are weakening sharply which rather pleads for a deepening of the correction until the EMA26.
ETF Objective
IEO is an ETF listed in USD, which seeks to replicate the Dow Jones U.S. Select Oil Exploration & Production Index (67 US companies)
Characteristics
| Inception date | 01/05/2006 |
| Expense ratio | 0,44% |
| Issuer | iShares |
| Benchmark | Dow Jones U.S. Oil Exploration & Production Index |
| Ticker | IEO |
| ISIN | US4642888519 |
| UCITS | No |
| Currency | $ |
| Exchange | BATS Exchange |
| Assets Under Mnagament | 495 M$ |
| Dividend | Distribution |
| RCurrency risk | No |
| Number of Holdings | 67 |
| Risk | 4/5 |
Country Breakdown
| USA | 100% |
Sector Breakdown
| Exploration & Production | 72% |
| Refining & Marketing & Transportation | 24% |
| Storage & Transportation | 4% |
Top Ten Holdings
| ConocoPhillips | 11% |
| EOG Resources | 9% |
| Phillips | 7% |
| Valero Energy | 7% |
| Anadarko Petroleum | 5% |
| Marathon Petroleum | 5% |
| Pioneer Natural Resource | 4% |
| Concho Resources | 3% |
| Devon Energy | 3% |
| Andeavor | 3% |